
Concept explainers
Videos
a.
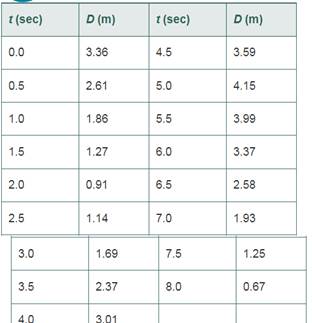
To plot: A regression curve on a scatter plot using the data given below
Given information:
The data is given
The plot of the
Where
The regression model based on the data and the scatter plot is a cubic regression model.
Graph is given below.
b.
To Explain: how far the person from motion detector to when the person changes the direction using the regression model .

Where distance is in
.
Given information:
The regression curve is given below.
Where distance is in
Based on the data and regression curve can understand the model is cubic regression model where the relation between time versus distance is about f
Based on the time can find the distance the from the motion detector by substituting the value for time
Chapter 2 Solutions
PRECALCULUS:...COMMON CORE ED.-W/ACCESS


- 2. Symmetry Evaluate the following integrals using symmetry argu- ments. Let R = {(x, y): -a ≤ x ≤ a, −b ≤ y ≤ b}, where a and b are positive real numbers. a. SS Sf xye xye¯(x² + y²) dA R b. C sin (x − y) - dA x² + y² + 1 Rarrow_forwardChoose a convenient order When converted to an iterated integral, the following double integrals are easier to evaluate in one order please show all stepsarrow_forwardplease show all workarrow_forward
- calc 3arrow_forward3. P 2. 1 -3-2-10 1 2 3 -2- X The graph of point P is given in the xy-plane. Which of the following are possible polar coordinates of point P? A Ⓐ(2, 2) (2, 1/1/1) B (2, 3) C Ⓒ =) (2√2, 41 ) D (2√2, 3) 4arrow_forwardThe graph of f' is below. Use it to determine where the local minima and maxima for f are. If there are multiple answers, separate with commas. 2 f'(x) N -5 -4 3-2-1 -1 -2 -3 -4 12 3 4 5 -x Local minima at x Local maxima at xarrow_forward
- The graph of f' is below. Use it to determine the intervals where f is increasing. -5-4-32 4- 3 2 1 -2 -3 +x 2 3 4 5arrow_forwardThe graph of f' is below. Use it to determine where the inflection points are and the intervals where f is concave up and concave down. If there are multiple inflection points, separate with a comma. 6 5 4 3 2 1 f'(x) +x -6-5-4-3 -2 -1 1 2 3 4 5 6 -1 -2 -3 -4 -5 -6+ Inflection point(s) at x = Concave up: Concave down:arrow_forwardThe graph of f' is below. Use it to determine where the local minima and maxima for f are. If there are multiple answers, separate with commas. f'(x) 4- -5-4-3-8-1 3 2 1 x 1 2 3 4 5 -1 -2 -3 -4 Local minima at a Local maxima at =arrow_forward
 Calculus: Early TranscendentalsCalculusISBN:9781285741550Author:James StewartPublisher:Cengage Learning
 Thomas' Calculus (14th Edition)CalculusISBN:9780134438986Author:Joel R. Hass, Christopher E. Heil, Maurice D. WeirPublisher:PEARSON
 Calculus: Early Transcendentals (3rd Edition)CalculusISBN:9780134763644Author:William L. Briggs, Lyle Cochran, Bernard Gillett, Eric SchulzPublisher:PEARSON
 Calculus: Early TranscendentalsCalculusISBN:9781319050740Author:Jon Rogawski, Colin Adams, Robert FranzosaPublisher:W. H. Freeman
 Calculus: Early Transcendental FunctionsCalculusISBN:9781337552516Author:Ron Larson, Bruce H. EdwardsPublisher:Cengage Learning