
Concept explainers
Videos
a.
To Confirm: The given linear model is appropriate.
The given model is linear.
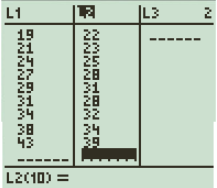
Given: Children's age and weight
| Age (months) | Weight (pounds) |
Calculation:
Press
Select required type, then press
Select Mark as

Press
Enter the data from the above table in the columns
Select the WINDOW as
Then press
The scatter plot is shown below:
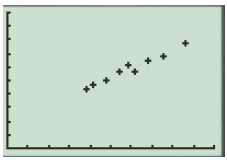
Thus, the given model is appropriately linear.
b.
To Determine: The linear regression model.
The linear regression model is
Given: Children's age and weight
| Age (months) | Weight (pounds) |
Calculation:
Press
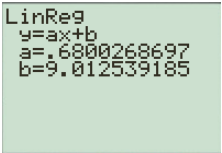
Find the linear regression model for the data is:
c.
To Interpret: The slope of the linear regression equation.
The slope of the linear regression equation is
Given: Children's age and weight
| Age (months) | Weight (pounds) |
Calculation:
From part (b) linear regression model, the slope of the regression line is
As a result, the children gained
d.
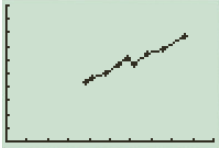
To Graph: Superimpose the regression line on the scatter plot.
Given: Children's age and weight
| Age (months) | Weight (pounds) |
Calculation:
Press
Select required type, then press
Select Mark as

Then press
e.
To Use: The regression model to estimate the weight of a 30-month-old girl.
The weight of a 30-month-old girl by using the regression model is
Given: Children's age and weight
| Age (months) | Weight (pounds) |
Calculation:
The linear regression model for the data is,
To find
Thus, the weight of a 30-month-old girl by using the regression model is
Chapter 2 Solutions
PRECALCULUS:...COMMON CORE ED.-W/ACCESS


- The graph of f' is below. Use it to determine where the local minima and maxima for f are. If there are multiple answers, separate with commas. 2 f'(x) N -5 -4 3-2-1 -1 -2 -3 -4 12 3 4 5 -x Local minima at x Local maxima at xarrow_forwardThe graph of f' is below. Use it to determine the intervals where f is increasing. -5-4-32 4- 3 2 1 -2 -3 +x 2 3 4 5arrow_forwardThe graph of f' is below. Use it to determine where the inflection points are and the intervals where f is concave up and concave down. If there are multiple inflection points, separate with a comma. 6 5 4 3 2 1 f'(x) +x -6-5-4-3 -2 -1 1 2 3 4 5 6 -1 -2 -3 -4 -5 -6+ Inflection point(s) at x = Concave up: Concave down:arrow_forward
- The graph of f' is below. Use it to determine where the local minima and maxima for f are. If there are multiple answers, separate with commas. f'(x) 4- -5-4-3-8-1 3 2 1 x 1 2 3 4 5 -1 -2 -3 -4 Local minima at a Local maxima at =arrow_forwardThe graph of f' is below. Use it to determine the intervals where f is increasing. f'(xx) 4- -5 -3 -2 3 2 1 1 2 3 4 5 Cit +x 7 2arrow_forwardPlease focus on problem ii.arrow_forward
 Calculus: Early TranscendentalsCalculusISBN:9781285741550Author:James StewartPublisher:Cengage Learning
 Thomas' Calculus (14th Edition)CalculusISBN:9780134438986Author:Joel R. Hass, Christopher E. Heil, Maurice D. WeirPublisher:PEARSON
 Calculus: Early Transcendentals (3rd Edition)CalculusISBN:9780134763644Author:William L. Briggs, Lyle Cochran, Bernard Gillett, Eric SchulzPublisher:PEARSON
 Calculus: Early TranscendentalsCalculusISBN:9781319050740Author:Jon Rogawski, Colin Adams, Robert FranzosaPublisher:W. H. Freeman
 Calculus: Early Transcendental FunctionsCalculusISBN:9781337552516Author:Ron Larson, Bruce H. EdwardsPublisher:Cengage Learning