
a.
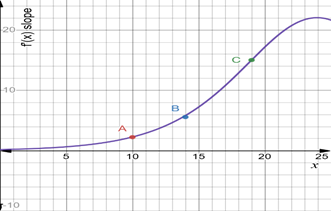
Graph of derivative of fruit fly population. What unit should be used for horizontal and vertical axis.
a.
Answer to Problem 7E
The graph derivative is given.
Explanation of Solution
Given:
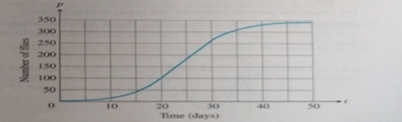
The given graph of the population is :
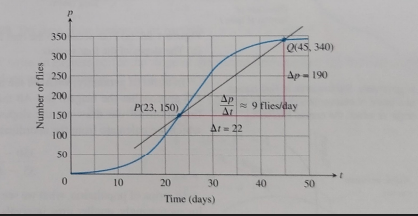
Calculation:
Estimate the slope of graph
At point A slope is 10, at point B slope is 14 and at point C slope is 19 . Tracing these points will give the graph of derivative. horizontal axis represents
The graph of derivative is given below:
b.
To find: During what days population seem increasing fastest and slowest.
b.
Answer to Problem 7E
During 15th to 25thdays population increasing fastest and during 30th to 50th day population increases at lowest rate.
Explanation of Solution
Given:
The graph of number of flies and days is given as:
Concept used: Find the slope at different points to find the number of flies per day.
Calculation:
Let’s take the points
Apply the formula
Substitute
12 flies per day increasing between 15 to 25 days.
Let’s take the another points
Apply the formula
Substitute
5 flies per day increasing between 30 to 50 days which is slowest.
Chapter 2 Solutions
CALCULUS-W/XL ACCESS

- Find the length of the following curve. 3 1 2 N x= 3 -y from y 6 to y=9arrow_forward3 4/3 3213 + 8 for 1 ≤x≤8. Find the length of the curve y=xarrow_forwardGiven that the outward flux of a vector field through the sphere of radius r centered at the origin is 5(1 cos(2r)) sin(r), and D is the value of the divergence of the vector field at the origin, the value of sin (2D) is -0.998 0.616 0.963 0.486 0.835 -0.070 -0.668 -0.129arrow_forward
- 10 The hypotenuse of a right triangle has one end at the origin and one end on the curve y = Express the area of the triangle as a function of x. A(x) =arrow_forwardIn Problems 17-26, solve the initial value problem. 17. dy = (1+ y²) tan x, y(0) = √√3arrow_forwardcould you explain this as well as disproving each wrong optionarrow_forward
- could you please show the computation of this by wiresarrow_forward4 Consider f(x) periodic function with period 2, coinciding with (x) = -x on the interval [,0) and being the null function on the interval [0,7). The Fourier series of f: (A) does not converge in quadratic norm to f(x) on [−π,π] (B) is pointwise convergent to f(x) for every x = R П (C) is in the form - 4 ∞ +Σ ak cos(kx) + bk sin(kx), ak ‡0, bk ‡0 k=1 (D) is in the form ak cos(kx) + bk sin(kx), ak 0, bk 0 k=1arrow_forwardSolve the equation.arrow_forward
 Calculus: Early TranscendentalsCalculusISBN:9781285741550Author:James StewartPublisher:Cengage Learning
 Thomas' Calculus (14th Edition)CalculusISBN:9780134438986Author:Joel R. Hass, Christopher E. Heil, Maurice D. WeirPublisher:PEARSON
 Calculus: Early Transcendentals (3rd Edition)CalculusISBN:9780134763644Author:William L. Briggs, Lyle Cochran, Bernard Gillett, Eric SchulzPublisher:PEARSON
 Calculus: Early TranscendentalsCalculusISBN:9781319050740Author:Jon Rogawski, Colin Adams, Robert FranzosaPublisher:W. H. Freeman
 Calculus: Early Transcendental FunctionsCalculusISBN:9781337552516Author:Ron Larson, Bruce H. EdwardsPublisher:Cengage Learning