Application Exercises Americans are getting married later in life, or not getting married at all In 2010 more than half of Americans ages 25 through 29 were unmarried. The bar graph shows the percentage of never-married men and women in this age group for four selected years The data are displayed as two sets of four points each one scatterplot for the percentage of never-married American men and one for the percentage of never –married American women. Also shown for each scatter plot is a line that passes through of near the four points. Use these lines to solve Exercises 87-88 Source U.S. Census Bureasu In this exercise, you win use the red line for the men shown on the scatter pw to develop a model for the percentage of never-married American males ages 25-29 a Use the two points whose coordinates are shown by the voice balloons to find the point-slope form of the equation of the line that models the percentage of never-married American males ages 25-29. y, x years after 1980. b. Write the equation from part (a) in slope-intercept form. Use function notation c. Use the linear function to predict the percentage of never-married American males, ages 25-29, in 2015.
Application Exercises Americans are getting married later in life, or not getting married at all In 2010 more than half of Americans ages 25 through 29 were unmarried. The bar graph shows the percentage of never-married men and women in this age group for four selected years The data are displayed as two sets of four points each one scatterplot for the percentage of never-married American men and one for the percentage of never –married American women. Also shown for each scatter plot is a line that passes through of near the four points. Use these lines to solve Exercises 87-88 Source U.S. Census Bureasu In this exercise, you win use the red line for the men shown on the scatter pw to develop a model for the percentage of never-married American males ages 25-29 a Use the two points whose coordinates are shown by the voice balloons to find the point-slope form of the equation of the line that models the percentage of never-married American males ages 25-29. y, x years after 1980. b. Write the equation from part (a) in slope-intercept form. Use function notation c. Use the linear function to predict the percentage of never-married American males, ages 25-29, in 2015.
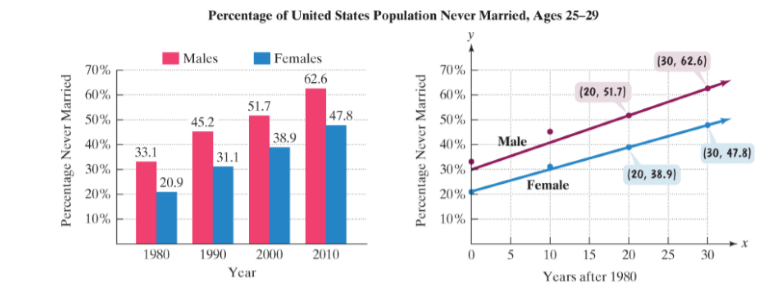
Americans are getting married later in life, or not getting married at all In 2010 more than half of Americans ages 25 through 29 were unmarried. The bar graph shows the percentage of never-married men and women in this age group for four selected years The data are displayed as two sets of four points each one scatterplot for the percentage of never-married American men and one for the percentage of never –married American women. Also shown for each scatter plot is a line that passes through of near the four points. Use these lines to solve Exercises 87-88
Source U.S. Census Bureasu
In this exercise, you win use the red line for the men shown on the scatter pw to develop a model for the percentage of never-married American males ages 25-29
a Use the two points whose coordinates are shown by the voice balloons to find the point-slope form of the equation of the line that models the percentage of never-married American males ages 25-29. y, x years after 1980.
b. Write the equation from part (a) in slope-intercept form. Use function notation
c. Use the linear function to predict the percentage of never-married American males, ages 25-29, in 2015.
Formula Formula Point-slope equation: The point-slope equation of a line passing through the point (x 1 , y 1 ) with slope m , is given by the following formula: y - y 1 = m x - x 1 Example: The point-slope equation of a line passing through (2, -6) with slope 5 is given by: y - (-6) = 5(x - 2) y + 6 = 5(x - 2)
Solutions of inequalitie
Google Classroom
Mic
Is (-3, 2) a solution of 7x+9y > -3?
Choose 1 answer:
A
Yes
B
No
Related content
▶6:06
Testing solutions to inequalities
2 of 4
Are natural logarithms used in real life ? How ? Can u give me two or three ways we can use them. Thanks
?
Chapter 2 Solutions
MyLab Math with Pearson eText -- Standalone Access Card -- for Algebra and Trigonometry (6th Edition)
Need a deep-dive on the concept behind this application? Look no further. Learn more about this topic, algebra and related others by exploring similar questions and additional content below.
Correlation Vs Regression: Difference Between them with definition & Comparison Chart; Author: Key Differences;https://www.youtube.com/watch?v=Ou2QGSJVd0U;License: Standard YouTube License, CC-BY
Correlation and Regression: Concepts with Illustrative examples; Author: LEARN & APPLY : Lean and Six Sigma;https://www.youtube.com/watch?v=xTpHD5WLuoA;License: Standard YouTube License, CC-BY


 Glencoe Algebra 1, Student Edition, 9780079039897...AlgebraISBN:9780079039897Author:CarterPublisher:McGraw Hill
 Holt Mcdougal Larson Pre-algebra: Student Edition...AlgebraISBN:9780547587776Author:HOLT MCDOUGALPublisher:HOLT MCDOUGAL
 Big Ideas Math A Bridge To Success Algebra 1: Stu...AlgebraISBN:9781680331141Author:HOUGHTON MIFFLIN HARCOURTPublisher:Houghton Mifflin Harcourt
 Functions and Change: A Modeling Approach to Coll...AlgebraISBN:9781337111348Author:Bruce Crauder, Benny Evans, Alan NoellPublisher:Cengage Learning