Concept explainers
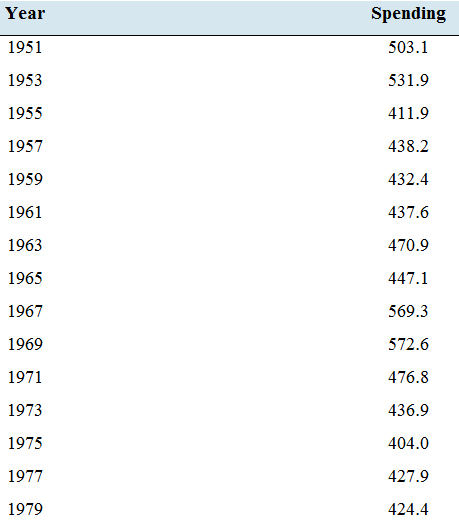
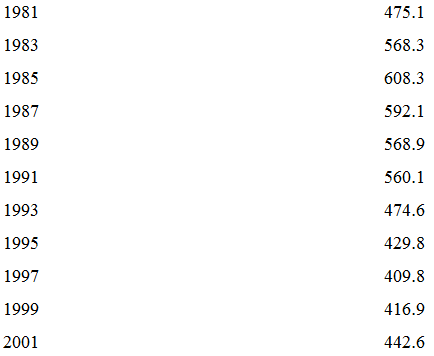
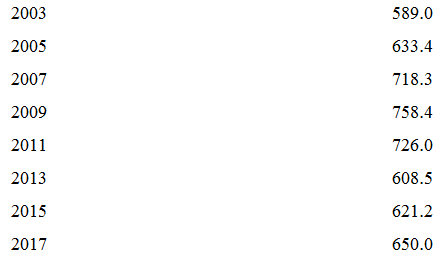
Military spending: The following table presents the amount spent, in billions of dollars, on national defense by the U.S. government every other year for the years 1951 through 2017. The amounts are adjusted for inflation, and represent 2017 dollars.


- Construct a time-series plot for these data.
- The plot covers seven decades, from the 1950s through the period 2010—2017. During which of these decades did national defense spending increase, and during which decades did it decrease?
- The United States fought in the Korean War, which ended in 1953. What effect did the end of the war have on military spending after 1953?
- During the period 1965—1963, the United States steadily increased the number of troops in Vietnam from 23,000 at the beginning of 1965 to 537.000 at the end of 1968.
Beginning in 1969, the number of Americans in Vietnam was steadily reduced, with the last of them leaving in 1975. How is this reflected in the national defense spending from 1965 to 1975?
a.
To construct:A time-series plot of the given data.
Explanation of Solution
Given information:
The dataset:
| Year | Spending |
| 1951 | 503.1 |
| 1953 | 531.9 |
| 1955 | 411.9 |
| 1957 | 438.2 |
| 1959 | 432.4 |
| 1961 | 437.6 |
| 1963 | 470.9 |
| 1965 | 447.1 |
| 1967 | 569.3 |
| 1969 | 572.6 |
| 1971 | 476.8 |
| 1973 | 436.9 |
| 1975 | 404.0 |
| 1977 | 427.9 |
| 1979 | 424.4 |
| 1981 | 475.1 |
| 1983 | 568.3 |
| 1985 | 608.3 |
| 1987 | 592.1 |
| 1989 | 568.9 |
| 1991 | 560.1 |
| 1993 | 474.6 |
| 1995 | 429.8 |
| 1997 | 409.8 |
| 1999 | 416.9 |
| 2001 | 442.6 |
| 2003 | 589.0 |
| 2005 | 633.4 |
| 2007 | 718.3 |
| 2009 | 758.4 |
| 2011 | 726.0 |
| 2013 | 608.5 |
| 2015 | 621.2 |
| 2017 | 650.0 |
Graph:
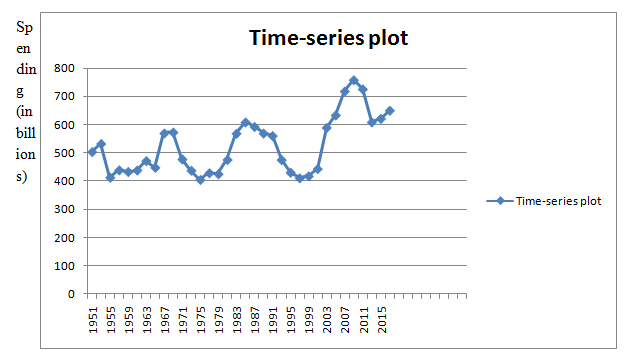
A time-series plot for the given data is given by

b.
To find:The decade during which the national defence spending increasing and the decade during which the national defence spending increasing.
Answer to Problem 27E
The trend in the vacancy rate during the time period from 2012 to 2015 is decreasing.
Explanation of Solution
Solution:
A time-series plot for the given data is given by

From the time-series plot, we can see that during 1960s, 1980s and 2000s, the national defence spending is increasing and during 1950s, 1970s, 1990s and 2010s, the national defence spending is decreasing
Hence,
Increased decade: 1960s, 1980s and 2000s
Decreased decade: 1950s, 1970s, 1990s and 2010s.
c.
To find: The effects of the end of the war have on military spending after 1953.
Answer to Problem 27E
The effects of the end of the war have on military spending after 1953 is that it caught a big decrease.
Explanation of Solution
Solution:
A time-series plot for the given data is given by

From the time-series plot, we can see that after 1953, there was causing a big decrease in the military spending. The military spending was falling from 531.9 to 411.9 during 1953-1955.
Hence, the effects of the end of the war have on military spending after 1953 is that there caused a big decrease.
d.
To explain: The reflection in the national defence spending from 1965 to 1975.
Answer to Problem 27E
The national defence spending is increased from 1965 to 1969 and then decreased from 1969 to 1975.
Explanation of Solution
Given information: The following table presents the amount spent, in billions of dollars, on national defence by the U.S. government every other year for the years 1951 through 2017. The amounts are adjusted for inflation, and represent 2017 dollars.
| Year | Spending |
| 1951 | 503.1 |
| 1953 | 531.9 |
| 1955 | 411.9 |
| 1957 | 438.2 |
| 1959 | 432.4 |
| 1961 | 437.6 |
| 1963 | 470.9 |
| 1965 | 447.1 |
| 1967 | 569.3 |
| 1969 | 572.6 |
| 1971 | 476.8 |
| 1973 | 436.9 |
| 1975 | 404.0 |
| 1977 | 427.9 |
| 1979 | 424.4 |
| 1981 | 475.1 |
| 1983 | 568.3 |
| 1985 | 608.3 |
| 1987 | 592.1 |
| 1989 | 568.9 |
| 1991 | 560.1 |
| 1993 | 474.6 |
| 1995 | 429.8 |
| 1997 | 409.8 |
| 1999 | 416.9 |
| 2001 | 442.6 |
| 2003 | 589.0 |
| 2005 | 633.4 |
| 2007 | 718.3 |
| 2009 | 758.4 |
| 2011 | 726.0 |
| 2013 | 608.5 |
| 2015 | 621.2 |
| 2017 | 650.0 |
During the period 1965-1968, the United States steadily increased the number of troops in Vietnam from 23,000 at the beginning of 1965 to 537,000 at the end of 1968. Beginning in 1969, the number of Americans in Vietnam was steadily reduced, with the last of themleaving in 1975.
A time-series plot for the given data is given by

From 1965 to 1975, the national defence spending is increasing from 1965 to 1969 and then decreasing from 1969 to 1975.
Hence, the national defence spending is increased from 1965 to 1969 and then decreased from 1969 to 1975.
Want to see more full solutions like this?
Chapter 2 Solutions
Connect Hosted by ALEKS Online Access for Elementary Statistics
- T1.4: Let ẞ(G) be the minimum size of a vertex cover, a(G) be the maximum size of an independent set and m(G) = |E(G)|. (i) Prove that if G is triangle free (no induced K3) then m(G) ≤ a(G)B(G). Hints - The neighborhood of a vertex in a triangle free graph must be independent; all edges have at least one end in a vertex cover. (ii) Show that all graphs of order n ≥ 3 and size m> [n2/4] contain a triangle. Hints - you may need to use either elementary calculus or the arithmetic-geometric mean inequality.arrow_forwardWe consider the one-period model studied in class as an example. Namely, we assumethat the current stock price is S0 = 10. At time T, the stock has either moved up toSt = 12 (with probability p = 0.6) or down towards St = 8 (with probability 1−p = 0.4).We consider a call option on this stock with maturity T and strike price K = 10. Theinterest rate on the money market is zero.As in class, we assume that you, as a customer, are willing to buy the call option on100 shares of stock for $120. The investor, who sold you the option, can adopt one of thefollowing strategies: Strategy 1: (seen in class) Buy 50 shares of stock and borrow $380. Strategy 2: Buy 55 shares of stock and borrow $430. Strategy 3: Buy 60 shares of stock and borrow $480. Strategy 4: Buy 40 shares of stock and borrow $280.(a) For each of strategies 2-4, describe the value of the investor’s portfolio at time 0,and at time T for each possible movement of the stock.(b) For each of strategies 2-4, does the investor have…arrow_forwardNegate the following compound statement using De Morgans's laws.arrow_forward
- Negate the following compound statement using De Morgans's laws.arrow_forwardQuestion 6: Negate the following compound statements, using De Morgan's laws. A) If Alberta was under water entirely then there should be no fossil of mammals.arrow_forwardNegate the following compound statement using De Morgans's laws.arrow_forward
- Characterize (with proof) all connected graphs that contain no even cycles in terms oftheir blocks.arrow_forwardLet G be a connected graph that does not have P4 or C3 as an induced subgraph (i.e.,G is P4, C3 free). Prove that G is a complete bipartite grapharrow_forwardProve sufficiency of the condition for a graph to be bipartite that is, prove that if G hasno odd cycles then G is bipartite as follows:Assume that the statement is false and that G is an edge minimal counterexample. That is, Gsatisfies the conditions and is not bipartite but G − e is bipartite for any edge e. (Note thatthis is essentially induction, just using different terminology.) What does minimality say aboutconnectivity of G? Can G − e be disconnected? Explain why if there is an edge between twovertices in the same part of a bipartition of G − e then there is an odd cyclearrow_forward

 College AlgebraAlgebraISBN:9781305115545Author:James Stewart, Lothar Redlin, Saleem WatsonPublisher:Cengage Learning

