
Videos
More freshmen: For the data in Exercise 6:
- Construct a frequency
polygon . - Construct a relative frequency polygon.
- Construct a frequency ogive.
- Construct a relative frequency ogive.
a.
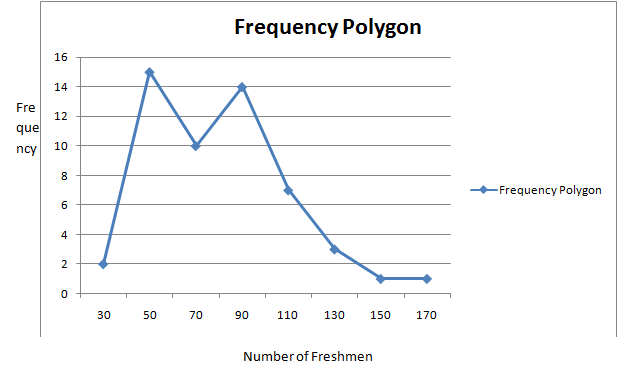
To construct:A frequency polygon.
Explanation of Solution
Given information: The following frequency distribution presents the number of freshmen elected in each of the past 53 elections from 1912 to 2016.
| Number of Freshmen | Frequency |
| 20-39 | 2 |
| 40-59 | 15 |
| 60-79 | 10 |
| 80-99 | 14 |
| 100-119 | 7 |
| 120-139 | 3 |
| 140-159 | 1 |
| 160-179 | 1 |
Formula used:
Calculation:
| Number of Freshmen | Class Midpoints | Frequency |
| 20-39 | 2 | |
| 40-59 | 15 | |
| 60-79 | 10 | |
| 80-99 | 14 | |
| 100-119 | 7 | |
| 120-139 | 3 | |
| 140-159 | 1 | |
| 160-179 | 1 |
Now plotting the points whose x-coordinates are the class midpoints and whose y-coordinates are the frequencies. Then the frequency polygon is connecting the points with straight line
b.
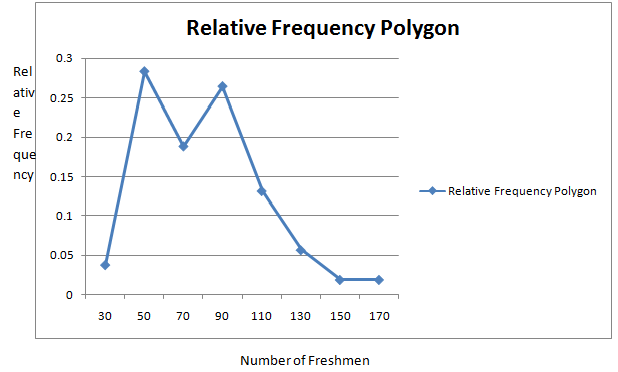
To construct: A relative frequency polygon.
Explanation of Solution
Given information: The following frequency distribution presents the number of freshmen elected in each of the past 53 elections from 1912 to 2016.
| Number of Freshmen | Frequency |
| 20-39 | 2 |
| 40-59 | 15 |
| 60-79 | 10 |
| 80-99 | 14 |
| 100-119 | 7 |
| 120-139 | 3 |
| 140-159 | 1 |
| 160-179 | 1 |
Formula used:
Calculation:
| Number of Freshmen | Class Midpoints | Frequency | Relative Frequency |
| 20-39 | 2 | ||
| 40-59 | 15 | ||
| 60-79 | 10 | ||
| 80-99 | 14 | ||
| 100-119 | 7 | ||
| 120-139 | 3 | ||
| 140-159 | 1 | ||
| 160-179 | 1 |
Now plotting the points whose x-coordinates are the class midpoints and whose y-coordinates are therelative frequencies. Then the relative frequency polygon is connecting the points with straight line.
s
c.
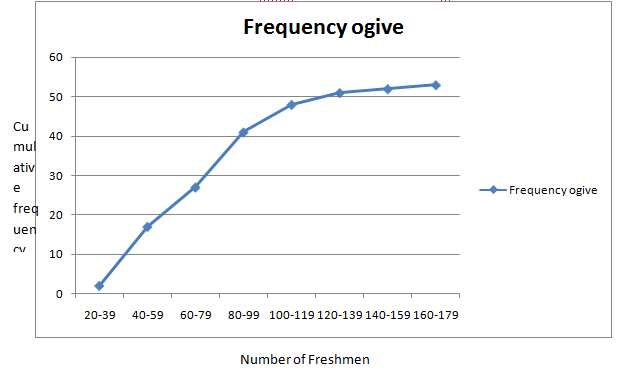
To construct: A frequency ogive.
Explanation of Solution
Given information: The following frequency distribution presents the number of freshmen elected in each of the past 53 elections from 1912 to 2016.
| Number of Freshmen | Frequency |
| 20-39 | 2 |
| 40-59 | 15 |
| 60-79 | 10 |
| 80-99 | 14 |
| 100-119 | 7 |
| 120-139 | 3 |
| 140-159 | 1 |
| 160-179 | 1 |
Definition used: The cumulative frequency of a class is the sum of the frequencies of that class and all previous classes.
Anogive plots the cumulative frequencies.
Calculation:
The cumulative classes are given by in the following table.
| Number of Freshmen | Frequency | Cumulative Frequency |
| 20-39 | 2 | 2 |
| 40-59 | 15 | |
| 60-79 | 10 | |
| 80-99 | 14 | |
| 100-119 | 7 | |
| 120-139 | 3 | |
| 140-159 | 1 | |
| 160-179 | 1 |
The frequency ogive is is given by
d.
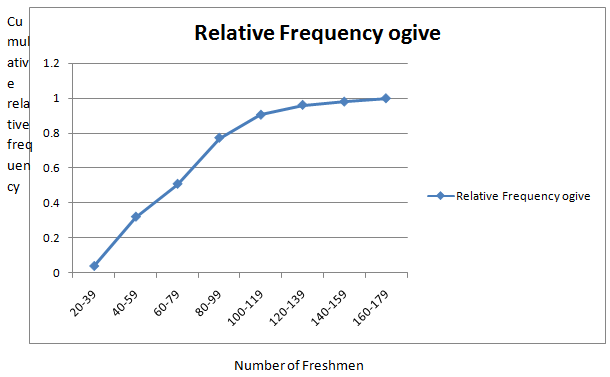
To construct: A relative frequency ogive.
Explanation of Solution
Given information: The following frequency distribution presents the number of freshmen elected in each of the past 53 elections from 1912 to 2016.
| Number of Freshmen | Frequency |
| 20-39 | 2 |
| 40-59 | 15 |
| 60-79 | 10 |
| 80-99 | 14 |
| 100-119 | 7 |
| 120-139 | 3 |
| 140-159 | 1 |
| 160-179 | 1 |
Definition used: The cumulative relative frequency of a class is given by
A relative frequency ogive plots the cumulative relative frequencies.
Calculation:
The cumulative classes are given by in the following table.
| Number of Freshmen | Frequency | Cumulative Frequency | Cumulative relative Frequency |
| 20-39 | 2 | 2 | |
| 40-59 | 15 | ||
| 60-79 | 10 | ||
| 80-99 | 14 | ||
| 100-119 | 7 | ||
| 120-139 | 3 | ||
| 140-159 | 1 | ||
| 160-179 | 1 |
The relative frequency ogive is is given by
Want to see more full solutions like this?
Chapter 2 Solutions
Connect Hosted by ALEKS Online Access for Elementary Statistics


- T1.4: Let ẞ(G) be the minimum size of a vertex cover, a(G) be the maximum size of an independent set and m(G) = |E(G)|. (i) Prove that if G is triangle free (no induced K3) then m(G) ≤ a(G)B(G). Hints - The neighborhood of a vertex in a triangle free graph must be independent; all edges have at least one end in a vertex cover. (ii) Show that all graphs of order n ≥ 3 and size m> [n2/4] contain a triangle. Hints - you may need to use either elementary calculus or the arithmetic-geometric mean inequality.arrow_forwardWe consider the one-period model studied in class as an example. Namely, we assumethat the current stock price is S0 = 10. At time T, the stock has either moved up toSt = 12 (with probability p = 0.6) or down towards St = 8 (with probability 1−p = 0.4).We consider a call option on this stock with maturity T and strike price K = 10. Theinterest rate on the money market is zero.As in class, we assume that you, as a customer, are willing to buy the call option on100 shares of stock for $120. The investor, who sold you the option, can adopt one of thefollowing strategies: Strategy 1: (seen in class) Buy 50 shares of stock and borrow $380. Strategy 2: Buy 55 shares of stock and borrow $430. Strategy 3: Buy 60 shares of stock and borrow $480. Strategy 4: Buy 40 shares of stock and borrow $280.(a) For each of strategies 2-4, describe the value of the investor’s portfolio at time 0,and at time T for each possible movement of the stock.(b) For each of strategies 2-4, does the investor have…arrow_forwardNegate the following compound statement using De Morgans's laws.arrow_forward
- Negate the following compound statement using De Morgans's laws.arrow_forwardQuestion 6: Negate the following compound statements, using De Morgan's laws. A) If Alberta was under water entirely then there should be no fossil of mammals.arrow_forwardNegate the following compound statement using De Morgans's laws.arrow_forward
- Characterize (with proof) all connected graphs that contain no even cycles in terms oftheir blocks.arrow_forwardLet G be a connected graph that does not have P4 or C3 as an induced subgraph (i.e.,G is P4, C3 free). Prove that G is a complete bipartite grapharrow_forwardProve sufficiency of the condition for a graph to be bipartite that is, prove that if G hasno odd cycles then G is bipartite as follows:Assume that the statement is false and that G is an edge minimal counterexample. That is, Gsatisfies the conditions and is not bipartite but G − e is bipartite for any edge e. (Note thatthis is essentially induction, just using different terminology.) What does minimality say aboutconnectivity of G? Can G − e be disconnected? Explain why if there is an edge between twovertices in the same part of a bipartition of G − e then there is an odd cyclearrow_forward
 Holt Mcdougal Larson Pre-algebra: Student Edition...AlgebraISBN:9780547587776Author:HOLT MCDOUGALPublisher:HOLT MCDOUGAL
 Glencoe Algebra 1, Student Edition, 9780079039897...AlgebraISBN:9780079039897Author:CarterPublisher:McGraw Hill
 Big Ideas Math A Bridge To Success Algebra 1: Stu...AlgebraISBN:9781680331141Author:HOUGHTON MIFFLIN HARCOURTPublisher:Houghton Mifflin Harcourt
 Functions and Change: A Modeling Approach to Coll...AlgebraISBN:9781337111348Author:Bruce Crauder, Benny Evans, Alan NoellPublisher:Cengage Learning