
Concept explainers
Videos
Ogive: Using the data in Exercise 28:
- Compute the cumulative frequencies for the classes in the American League frequency distribution.
- Construct a frequency ogive for the American League frequency distribution.
- Compute the cumulative relative frequencies for the classes in the American League frequency distribution.
- Construct a relative frequency ogive for the American League, using the same classes.
- Compute the cumulative frequencies for the classes in the National League frequency distribution.
- Construct a frequency ogive for the National League frequency distribution.
- Compute the cumulative relative frequencies for the classes in the National League frequency distribution.
- Construct a relative frequency ogive for the National League, using the same classes.
a.
To compute:The cumulative frequencies for the classes in the American League frequency distribution.
Answer to Problem 44E
| Batting average | American League Cumulative Frequency |
| 0.180-0.199 | 2 |
| 0.200-0.219 | 9 |
| 0.220-0.239 | 30 |
| 0.240-0.259 | 60 |
| 0.260-0.279 | 86 |
| 0.280-0.299 | 107 |
| 0.300-0.319 | 119 |
| 0.320-0.339 | 124 |
| 0.340-0.359 | 124 |
Explanation of Solution
Given information:The following frequency distribution presents the batting averages of Major League Baseball players in both the American League and the National League who had 300 or more plate appearances during a recent season.
| Batting average | American LeagueFrequency | National LeagueFrequency |
| 0.180-0.199 | 2 | 2 |
| 0.200-0.219 | 7 | 7 |
| 0.220-0.239 | 21 | 20 |
| 0.240-0.259 | 30 | 29 |
| 0.260-0.279 | 26 | 32 |
| 0.280-0.299 | 21 | 30 |
| 0.300-0.319 | 12 | 17 |
| 0.320-0.339 | 5 | 5 |
| 0.340-0.359 | 0 | 1 |
Definition used: The cumulative frequency of a class is the sum of the frequencies of that class and all previous classes.
Calculation:
The cumulative classes are given by in the following table.
| Batting average | American LeagueFrequency | American League Cumulative Frequency |
| 0.180-0.199 | 2 | 2 |
| 0.200-0.219 | 7 | |
| 0.220-0.239 | 21 | |
| 0.240-0.259 | 30 | |
| 0.260-0.279 | 26 | |
| 0.280-0.299 | 21 | |
| 0.300-0.319 | 12 | |
| 0.320-0.339 | 5 | |
| 0.340-0.359 | 0 |
Hence, the cumulative frequency for American league is given by
| Batting average | American League Cumulative Frequency |
| 0.180-0.199 | 2 |
| 0.200-0.219 | 9 |
| 0.220-0.239 | 30 |
| 0.240-0.259 | 60 |
| 0.260-0.279 | 86 |
| 0.280-0.299 | 107 |
| 0.300-0.319 | 119 |
| 0.320-0.339 | 124 |
| 0.340-0.359 | 124 |
b.
To find:The frequency ogive for the frequency distribution.
Explanation of Solution
Given information:The following frequency distribution presents the batting averages of Major League Baseball players in both the American League and the National League who had 300 or more plate appearances during a recent season.
| Batting average | American LeagueFrequency | National LeagueFrequency |
| 0.180-0.199 | 2 | 2 |
| 0.200-0.219 | 7 | 7 |
| 0.220-0.239 | 21 | 20 |
| 0.240-0.259 | 30 | 29 |
| 0.260-0.279 | 26 | 32 |
| 0.280-0.299 | 21 | 30 |
| 0.300-0.319 | 12 | 17 |
| 0.320-0.339 | 5 | 5 |
| 0.340-0.359 | 0 | 1 |
Definition used:An ogive plots the cumulative frequencies.
Solution:
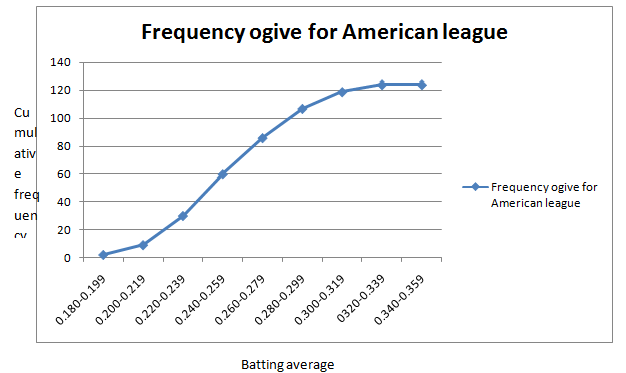
The table of cumulative American League frequency is given by
| Batting average | American League Cumulative Frequency |
| 0.180-0.199 | 2 |
| 0.200-0.219 | 9 |
| 0.220-0.239 | 30 |
| 0.240-0.259 | 60 |
| 0.260-0.279 | 86 |
| 0.280-0.299 | 107 |
| 0.300-0.319 | 119 |
| 0.320-0.339 | 124 |
| 0.340-0.359 | 124 |
The frequency ogivefor American League frequency distribution is given by
c.
To compute: The cumulative relative frequencies for the classes in the American league frequency distribution.
Answer to Problem 44E
| Batting average | Cumulative relative Frequency |
| 0.180-0.199 | 0.016 |
| 0.200-0.219 | 0.073 |
| 0.220-0.239 | 0.242 |
| 0.240-0.259 | 0.484 |
| 0.260-0.279 | 0.694 |
| 0.280-0.299 | 0.863 |
| 0.300-0.319 | 0.960 |
| 0.320-0.339 | 1.000 |
| 0.340-0.359 | 1.000 |
Explanation of Solution
Given information: The following frequency distribution presents the batting averages of Major League Baseball players in both the American League and the National League who had 300 or more plate appearances during a recent season.
| Batting average | American LeagueFrequency | National LeagueFrequency |
| 0.180-0.199 | 2 | 2 |
| 0.200-0.219 | 7 | 7 |
| 0.220-0.239 | 21 | 20 |
| 0.240-0.259 | 30 | 29 |
| 0.260-0.279 | 26 | 32 |
| 0.280-0.299 | 21 | 30 |
| 0.300-0.319 | 12 | 17 |
| 0.320-0.339 | 5 | 5 |
| 0.340-0.359 | 0 | 1 |
Definition used: The cumulative relative frequency of a class is given by
Calculation:
The cumulative classes are given by in the following table.
| Batting average | American League Cumulative Frequency | American League relative Cumulative Frequency |
| 0.180-0.199 | 2 | |
| 0.200-0.219 | 9 | |
| 0.220-0.239 | 30 | |
| 0.240-0.259 | 60 | |
| 0.260-0.279 | 86 | |
| 0.280-0.299 | 107 | |
| 0.300-0.319 | 119 | |
| 0.320-0.339 | 124 | |
| 0.340-0.359 | 124 |
Hence, the cumulative relative frequency is given by
| Batting average | Cumulative relative Frequency |
| 0.180-0.199 | 0.016 |
| 0.200-0.219 | 0.073 |
| 0.220-0.239 | 0.242 |
| 0.240-0.259 | 0.484 |
| 0.260-0.279 | 0.694 |
| 0.280-0.299 | 0.863 |
| 0.300-0.319 | 0.960 |
| 0.320-0.339 | 1.000 |
| 0.340-0.359 | 1.000 |
d.
To find: The relative frequency ogive for the American league frequency distribution.
Explanation of Solution
Given information:The following frequency distribution presents the batting averages of Major League Baseball players in both the American League and the National League who had 300 or more plate appearances during a recent season.
| Batting average | American LeagueFrequency | National LeagueFrequency |
| 0.180-0.199 | 2 | 2 |
| 0.200-0.219 | 7 | 7 |
| 0.220-0.239 | 21 | 20 |
| 0.240-0.259 | 30 | 29 |
| 0.260-0.279 | 26 | 32 |
| 0.280-0.299 | 21 | 30 |
| 0.300-0.319 | 12 | 17 |
| 0.320-0.339 | 5 | 5 |
| 0.340-0.359 | 0 | 1 |
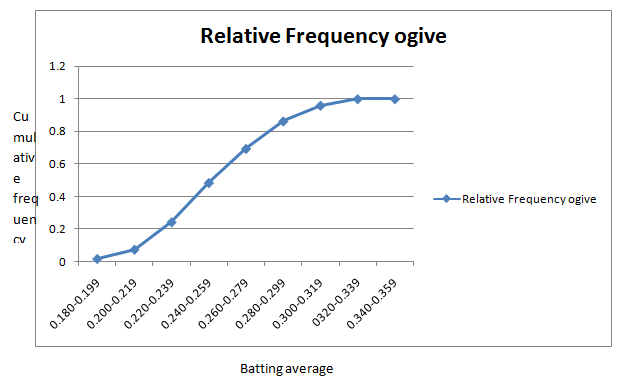
Definition used:A relative frequency ogive plots the cumulative relative frequencies..
Solution:
The table of cumulative relative frequency is given by
| Batting average | Cumulative relative Frequency |
| 0.180-0.199 | 0.016 |
| 0.200-0.219 | 0.073 |
| 0.220-0.239 | 0.242 |
| 0.240-0.259 | 0.484 |
| 0.260-0.279 | 0.694 |
| 0.280-0.299 | 0.863 |
| 0.300-0.319 | 0.960 |
| 0.320-0.339 | 1.000 |
| 0.340-0.359 | 1.000 |
The relative frequency ogive is given by
e.
To compute: The cumulative frequencies for the classes in the National League frequency distribution.
Answer to Problem 44E
| Batting average | National League Cumulative Frequency |
| 0.180-0.199 | 2 |
| 0.200-0.219 | 9 |
| 0.220-0.239 | 29 |
| 0.240-0.259 | 58 |
| 0.260-0.279 | 90 |
| 0.280-0.299 | 120 |
| 0.300-0.319 | 137 |
| 0.320-0.339 | 142 |
| 0.340-0.359 | 143 |
Explanation of Solution
Given information: The following frequency distribution presents the batting averages of Major League Baseball players in both the American League and the National League who had 300 or more plate appearances during a recent season.
| Batting average | American LeagueFrequency | National LeagueFrequency |
| 0.180-0.199 | 2 | 2 |
| 0.200-0.219 | 7 | 7 |
| 0.220-0.239 | 21 | 20 |
| 0.240-0.259 | 30 | 29 |
| 0.260-0.279 | 26 | 32 |
| 0.280-0.299 | 21 | 30 |
| 0.300-0.319 | 12 | 17 |
| 0.320-0.339 | 5 | 5 |
| 0.340-0.359 | 0 | 1 |
Definition used: The cumulative frequency of a class is the sum of the frequencies of that class and all previous classes.
Calculation:
The cumulative classes are given by in the following table.
| Batting average | National LeagueFrequency | National League Cumulative Frequency |
| 0.180-0.199 | 2 | 2 |
| 0.200-0.219 | 7 | |
| 0.220-0.239 | 20 | |
| 0.240-0.259 | 29 | |
| 0.260-0.279 | 32 | |
| 0.280-0.299 | 30 | |
| 0.300-0.319 | 17 | |
| 0.320-0.339 | 5 | |
| 0.340-0.359 | 1 |
Hence, the cumulative frequency for National league is given by
| Batting average | National League Cumulative Frequency |
| 0.180-0.199 | 2 |
| 0.200-0.219 | 9 |
| 0.220-0.239 | 29 |
| 0.240-0.259 | 58 |
| 0.260-0.279 | 90 |
| 0.280-0.299 | 120 |
| 0.300-0.319 | 137 |
| 0.320-0.339 | 142 |
| 0.340-0.359 | 143 |
h.
To find: The frequency ogive for the National League frequency distribution.
Explanation of Solution
Given information:The following frequency distribution presents the batting averages of Major League Baseball players in both the American League and the National League who had 300 or more plate appearances during a recent season.
| Batting average | American LeagueFrequency | National LeagueFrequency |
| 0.180-0.199 | 2 | 2 |
| 0.200-0.219 | 7 | 7 |
| 0.220-0.239 | 21 | 20 |
| 0.240-0.259 | 30 | 29 |
| 0.260-0.279 | 26 | 32 |
| 0.280-0.299 | 21 | 30 |
| 0.300-0.319 | 12 | 17 |
| 0.320-0.339 | 5 | 5 |
| 0.340-0.359 | 0 | 1 |
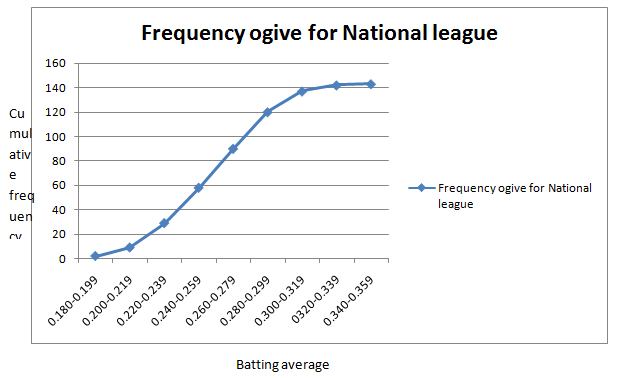
Definition used: An ogive plots the cumulative frequencies.
Solution:
The table of cumulative National League frequency is given by
| Batting average | National League Cumulative Frequency |
| 0.180-0.199 | 2 |
| 0.200-0.219 | 9 |
| 0.220-0.239 | 29 |
| 0.240-0.259 | 58 |
| 0.260-0.279 | 90 |
| 0.280-0.299 | 120 |
| 0.300-0.319 | 137 |
| 0.320-0.339 | 142 |
| 0.340-0.359 | 143 |
The frequency ogive for National League frequency distribution is given by
g.
To compute: The cumulative relative frequencies for the classes in the National league frequency distribution.
Answer to Problem 44E
| Batting average | Cumulative relative Frequency |
| 0.180-0.199 | 0.014 |
| 0.200-0.219 | 0.063 |
| 0.220-0.239 | 0.203 |
| 0.240-0.259 | 0.406 |
| 0.260-0.279 | 0.629 |
| 0.280-0.299 | 0.839 |
| 0.300-0.319 | 0.958 |
| 0.320-0.339 | 0.993 |
| 0.340-0.359 | 1.000 |
Explanation of Solution
Given information: The following frequency distribution presents the batting averages of Major League Baseball players in both the American League and the National League who had 300 or more plate appearances during a recent season.
| Batting average | American LeagueFrequency | National LeagueFrequency |
| 0.180-0.199 | 2 | 2 |
| 0.200-0.219 | 7 | 7 |
| 0.220-0.239 | 21 | 20 |
| 0.240-0.259 | 30 | 29 |
| 0.260-0.279 | 26 | 32 |
| 0.280-0.299 | 21 | 30 |
| 0.300-0.319 | 12 | 17 |
| 0.320-0.339 | 5 | 5 |
| 0.340-0.359 | 0 | 1 |
Definition used: The cumulative relative frequency of a class is given by
Calculation:
The cumulative classes are given by in the following table.
| Batting average | National League Cumulative Frequency | Cumulative relative frequency |
| 0.180-0.199 | 2 | |
| 0.200-0.219 | 9 | |
| 0.220-0.239 | 29 | |
| 0.240-0.259 | 58 | |
| 0.260-0.279 | 90 | |
| 0.280-0.299 | 120 | |
| 0.300-0.319 | 137 | |
| 0.320-0.339 | 142 | |
| 0.340-0.359 | 143 |
Hence, the cumulative relative frequency for National league is given by
| Batting average | Cumulative relative Frequency |
| 0.180-0.199 | 0.014 |
| 0.200-0.219 | 0.063 |
| 0.220-0.239 | 0.203 |
| 0.240-0.259 | 0.406 |
| 0.260-0.279 | 0.629 |
| 0.280-0.299 | 0.839 |
| 0.300-0.319 | 0.958 |
| 0.320-0.339 | 0.993 |
| 0.340-0.359 | 1.000 |
h.
To find: The relative frequency ogive for the National league frequency distribution.
Explanation of Solution
Given information:The following frequency distribution presents the batting averages of Major League Baseball players in both the American League and the National League who had 300 or more plate appearances during a recent season.
| Batting average | American LeagueFrequency | National LeagueFrequency |
| 0.180-0.199 | 2 | 2 |
| 0.200-0.219 | 7 | 7 |
| 0.220-0.239 | 21 | 20 |
| 0.240-0.259 | 30 | 29 |
| 0.260-0.279 | 26 | 32 |
| 0.280-0.299 | 21 | 30 |
| 0.300-0.319 | 12 | 17 |
| 0.320-0.339 | 5 | 5 |
| 0.340-0.359 | 0 | 1 |
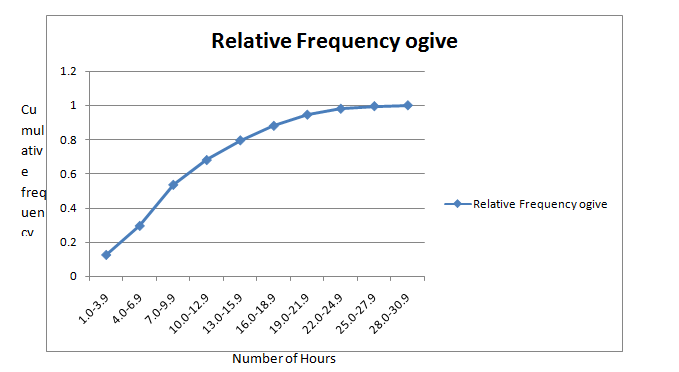
Definition used:A relative frequency ogive plots the cumulative relative frequencies..
Solution:
The table of cumulative relative frequency for the National league frequency distribution is given by
| Batting average | Cumulative relative Frequency |
| 0.180-0.199 | 0.014 |
| 0.200-0.219 | 0.063 |
| 0.220-0.239 | 0.203 |
| 0.240-0.259 | 0.406 |
| 0.260-0.279 | 0.629 |
| 0.280-0.299 | 0.839 |
| 0.300-0.319 | 0.958 |
| 0.320-0.339 | 0.993 |
| 0.340-0.359 | 1.000 |
The relative frequency ogivefor National League is given by
Want to see more full solutions like this?
Chapter 2 Solutions
Connect Hosted by ALEKS Online Access for Elementary Statistics


- You draw two cards from a standard deck of 52 cards, but before you draw the second card, you put the first one back and reshuffle the deck. If you get a3on the first card, find the probability of drawing a 3 for the second card.arrow_forwardDo bonds reduce the overall risk of an investment portfolio? Let x be a random variable representing annual percent return for the Vanguard Total Stock Index (all Stocks). Let y be a random variable representing annual return for the Vanguard Balanced Index (60% stock and 40% bond). For the past several years, assume the following data. Compute the coefficient of variation for each fund. Round your answers to the nearest tenth. x: 14 0 37 21 35 23 24 -14 -14 -17 y: 8 -2 29 17 22 17 17 -2 -3 -8arrow_forwardWhat percentage of the general U.S. population have bachelor's degrees? Suppose that the Statistical Abstract of the United States, 120th Edition, gives the following percentage of bachelor’s degrees by state. For convenience, the data are sorted in increasing order. 17 18 18 18 19 20 20 20 21 21 21 21 21 22 22 22 22 22 23 23 24 24 24 24 24 25 25 25 25 26 26 26 26 26 26 27 27 27 28 28 28 29 29 31 31 32 32 34 35 38 Illinois has a bachelor's degree percentage rate of about 18%. Into what quartile does this rate fall?arrow_forward
- What percentage of the general U.S. population have bachelor's degrees? Suppose that the Statistical Abstract of the United States, 120th Edition, gives the following percentage of bachelor’s degrees by state. For convenience, the data are sorted in increasing order. 17 18 18 18 19 20 20 20 21 21 21 21 21 22 22 22 22 22 23 23 24 24 24 24 24 25 25 25 25 26 26 26 26 26 26 27 27 27 28 28 28 29 29 31 31 32 32 34 35 38 Illinois has a bachelor's degree percentage rate of about 18%. Into what quartile does this rate fall?arrow_forwardFind the range for the following sample data. x 23 17 11 30 27arrow_forwardDo bonds reduce the overall risk of an investment portfolio? Let x be a random variable representing annual percent return for the Vanguard Total Stock Index (all Stocks). Let y be a random variable representing annual return for the Vanguard Balanced Index (60% stock and 40% bond). For the past several years, assume the following data. Compute the sample mean for x and for y. Round your answer to the nearest tenth. x: 11 0 36 22 34 24 25 -11 -11 -22 y: 9 -3 28 14 23 16 14 -3 -4 -9arrow_forward
- Do bonds reduce the overall risk of an investment portfolio? Let x be a random variable representing annual percent return for the Vanguard Total Stock Index (all Stocks). Let y be a random variable representing annual return for the Vanguard Balanced Index (60% stock and 40% bond). For the past several years, assume the following data. Compute the range for variable y. X 12 0 36 21 35 23 24 -12 -12 -21 Y 10 -2 26 15 22 18 15 -2 -3 -10arrow_forwardDo bonds reduce the overall risk of an investment portfolio? Let x be a random variable representing annual percent return for the Vanguard Total Stock Index (all Stocks). Let y be a random variable representing annual return for the Vanguard Balanced Index (60% stock and 40% bond). For the past several years, assume the following data. Compute the range for variable y. X 12 0 36 21 35 23 24 -12 -12 -21 Y 10 -2 26 15 22 18 15 -2 -3 -10arrow_forwardDo bonds reduce the overall risk of an investment portfolio? Let x be a random variable representing annual percent return for the Vanguard Total Stock Index (all Stocks). Let y be a random variable representing annual return for the Vanguard Balanced Index (60% stock and 40% bond). For the past several years, assume the following data. Compute the range for variable x. X 15 0 37 23 33 25 26 -15 -15 -23 Y 6 -1 28 18 24 17 18 -1 -2 -6arrow_forward
- 7.16. If the probability density of X is given by g kx³ for x>0 f(x) = (1+2x)6 0 10-01, elsewhere trolls inf ( 2X density of the random variable Y = where k is an appropriate constant, find the probability 1+2X distribution of Y, and thus determine the value of k. 7 Identify thearrow_forward7.1. If X has an exponential distribution with the parameter 0, use the distribution function technique to find the probability density of the random variable Y = ln X. bilaga in dwreatarrow_forward3. Pleasearrow_forward
 Holt Mcdougal Larson Pre-algebra: Student Edition...AlgebraISBN:9780547587776Author:HOLT MCDOUGALPublisher:HOLT MCDOUGAL
 Glencoe Algebra 1, Student Edition, 9780079039897...AlgebraISBN:9780079039897Author:CarterPublisher:McGraw Hill
 Big Ideas Math A Bridge To Success Algebra 1: Stu...AlgebraISBN:9781680331141Author:HOUGHTON MIFFLIN HARCOURTPublisher:Houghton Mifflin Harcourt