
Concept explainers
(a)
Interpretation:
The potential of the electrode with respect to a Ag/AgCl(sat’d) reference electrode after addition of different volumes of Cerium(IV) should be calculated.
Concept introduction:
Nernst equation gives the cell potential under non-standard conditions.
E − cell potential
E0 − standard cell potential
R − universal gas constant
T − temperature in Kelvin
n − number of electrons transferred
F − Faraday constant
Q − Reaction quotient
Answer to Problem 23.24QAP
| Volume of Ce4+, mL | Ecell, V |
| 5.00 | 0.712754 |
| 10.00 | 0.723179 |
| 15.00 | 0.730108 |
| 20.00 | 0.735787 |
| 24.00 | 0.739971 |
| 24.90 | 0.740897 |
| 25.00 | 0.741 |
| 40.00 | 0.75882 |
| 45.00 | 0.769244 |
| 49.00 | 0.791022 |
| 49.50 | 0.800055 |
| 49.60 | 0.802945 |
| 49.70 | 0.806663 |
| 49.80 | 0.811887 |
| 49.90 | 0.820784 |
| 49.95 | 0.829627 |
| 49.99 | 0.849708 |
| 50.00 | 0.907667 |
| 50.01 | 1.020361 |
| 50.05 | 1.063076 |
| 50.10 | 1.081059 |
| 50.20 | 1.098961 |
| 50.30 | 1.109413 |
| 50.40 | 1.116822 |
| 50.50 | 1.122568 |
| 51.00 | 1.140405 |
| 55.00 | 1.181796 |
| 60.00 | 1.199619 |
| 75.00 | 1.223178 |
| 90.00 | 1.235262 |
Explanation of Solution
The electrode potentials for half cell reactions are as follows:
The overall reaction will be:
Overall reaction:
The system is at equilibrium all time. So, the electrode potential for the two half-cell reactions are always equal
(1) + (2) x 2
Since, the hydrogen ion concentration is at 1.00 M throughout the titration,one can simplify the above equation.
At equivalence point,
So,
Potential before the equivalence point can be determined by applying the Nernst equation for HNO2/NO3- half-cell reaction. And potential after the equivalence point can be determined by applying Nernst equation for the Ce4+/Ce3+ half-cell reaction.
Initial concentration of HNO2 =
Volume of Ce4+ spent at the equivalence point =
When 5.00 mL of Ce4+ solution is added,
Concentration of NO3- =
=
Concentration of HNO2 left =
=
When 50.01 mL of Ce4+ added
Concentration of Ce4+ =
=
Concentration of Ce3+ =
=
likewise, one can calculate the concentrations of the species when other volumes of Ce4+ added. And then the electrode potential can be calculated. The potential of the indicator electrode with respect to a Ag/AgCl reference electrode can be calculated by subtracting the Ag/AgCl standard electrode potential from the electrode potential for the redox reaction calculated.
| Volume of Ce4+, mL | [NO3-] | [HNO2] | [Ce3+] | [Ce4+] | Ecell, V |
| 5.00 | 0.0025 | 0.0225 | 0.712754 | ||
| 10.00 | 0.004705882 | 0.018824 | 0.723179 | ||
| 15.00 | 0.006666667 | 0.015556 | 0.730108 | ||
| 20.00 | 0.008421053 | 0.012632 | 0.735787 | ||
| 24.00 | 0.00969697 | 0.010505 | 0.739971 | ||
| 24.90 | 0.00996997 | 0.01005 | 0.740897 | ||
| 25.00 | 0.01 | 0.01 | 0.741 | ||
| 40.00 | 0.013913043 | 0.003478 | 0.75882 | ||
| 45.00 | 0.015 | 0.001667 | 0.769244 | ||
| 49.00 | 0.015806452 | 0.000323 | 0.791022 | ||
| 49.50 | 0.015903614 | 0.000161 | 0.800055 | ||
| 49.60 | 0.015922953 | 0.000129 | 0.802945 | ||
| 49.70 | 0.015942261 | 9.64E-05 | 0.806663 | ||
| 49.80 | 0.015961538 | 6.43E-05 | 0.811887 | ||
| 49.90 | 0.015980785 | 3.22E-05 | 0.820784 | ||
| 49.95 | 0.015990396 | 1.62E-05 | 0.829627 | ||
| 49.99 | 0.01599808 | 3.4E-06 | 0.849708 | ||
| 50.00 | 0.907667 | ||||
| 50.01 | 0.031998 | 5.99952E-06 | 1.020361 | ||
| 50.05 | 0.031988 | 3.15874E-05 | 1.063076 | ||
| 50.10 | 0.031975 | 6.35492E-05 | 1.081059 | ||
| 50.20 | 0.031949 | 0.000127396 | 1.098961 | ||
| 50.30 | 0.031924 | 0.000191141 | 1.109413 | ||
| 50.40 | 0.031898 | 0.000254785 | 1.116822 | ||
| 50.50 | 0.031873 | 0.000318327 | 1.122568 | ||
| 51.00 | 0.031746 | 0.000634524 | 1.140405 | ||
| 55.00 | 0.03077 | 0.003076538 | 1.181796 | ||
| 60.00 | 0.02963 | 0.005925556 | 1.199619 | ||
| 75.00 | 0.026667 | 0.013333 | 1.223178 | ||
| 90.00 | 0.024243 | 0.019393636 | 1.235262 |
(b)
Interpretation:
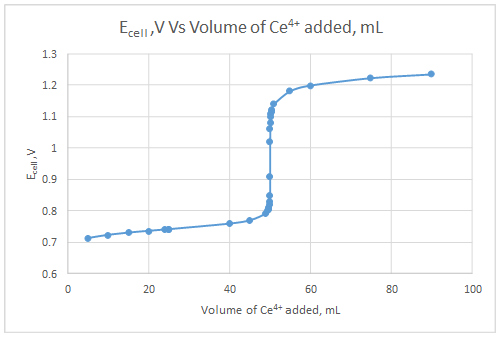
A titration curve should be constructed
Concept introduction:
Potentiometric titration is similar to direct redox titrations but in potentiometric titrations no indicator is used. Instead, the potential is measured during the titration to obtain the equivalence point.
Answer to Problem 23.24QAP
Explanation of Solution
The dependent variable is the indicator electrode potential and the independent variable is volume of Ce4+ solution added.

(c)
Interpretation:
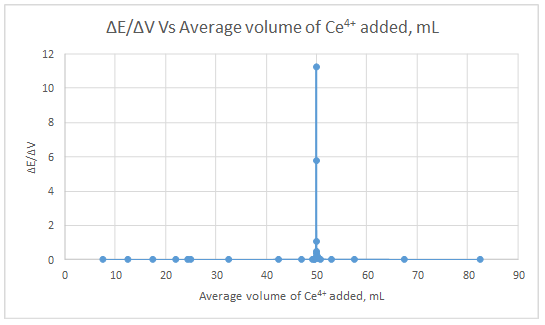
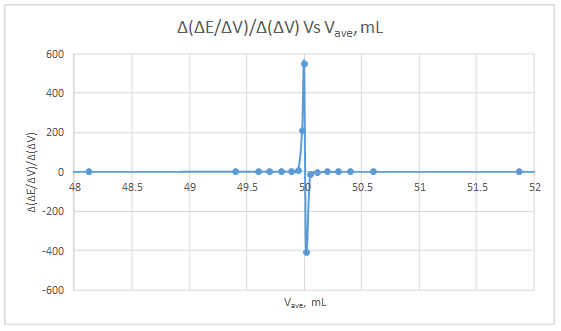
A first and second derivative curve for the data should be generated.
Concept introduction:
The first derivative curve of the potentiometric titration is plotted between
Answer to Problem 23.24QAP
First derivative curve:
Second derivative curve:
Explanation of Solution
| ΔE | ΔV | ΔE/ΔV | Vave | Δ(ΔE/ΔV) | Δ(ΔV) | Δ(ΔE/ΔV)/Δ(ΔV) | Vave |
| 0.010425 | 5 | 0.002085 | 7.5 | ||||
| 0.006929 | 5 | 0.001386 | 12.5 | -0.0006992 | 5 | -0.00013984 | 10 |
| 0.005679 | 5 | 0.001136 | 17.5 | -0.00025 | 5 | -5E-05 | 15 |
| 0.004184 | 4 | 0.001046 | 22 | -8.98E-05 | 4.5 | -1.99556E-05 | 19.75 |
| 0.000926 | 0.9 | 0.001029 | 24.45 | -1.71111E-05 | 2.45 | -6.98413E-06 | 23.225 |
| 0.000103 | 0.1 | 0.00103 | 24.95 | 1.11111E-06 | 0.5 | 2.22222E-06 | 24.7 |
| 0.01782 | 15 | 0.001188 | 32.5 | 0.000158 | 7.55 | 2.09272E-05 | 28.725 |
| 0.010424 | 5 | 0.002085 | 42.5 | 0.0008968 | 10 | 8.968E-05 | 37.5 |
| 0.021778 | 4 | 0.005444 | 47 | 0.0033597 | 4.5 | 0.0007466 | 44.75 |
| 0.009033 | 0.5 | 0.018066 | 49.25 | 0.0126215 | 2.25 | 0.005609556 | 48.125 |
| 0.00289 | 0.1 | 0.0289 | 49.55 | 0.010834 | 0.3 | 0.036113333 | 49.4 |
| 0.003718 | 0.1 | 0.03718 | 49.65 | 0.00828 | 0.1 | 0.0828 | 49.6 |
| 0.005224 | 0.1 | 0.05224 | 49.75 | 0.01506 | 0.1 | 0.1506 | 49.7 |
| 0.008897 | 0.1 | 0.08897 | 49.85 | 0.03673 | 0.1 | 0.3673 | 49.8 |
| 0.008843 | 0.05 | 0.17686 | 49.925 | 0.08789 | 0.075 | 1.171866667 | 49.8875 |
| 0.020081 | 0.04 | 0.502025 | 49.97 | 0.325165 | 0.045 | 7.225888889 | 49.9475 |
| 0.057959 | 0.01 | 5.7959 | 49.995 | 5.293875 | 0.025 | 211.755 | 49.9825 |
| 0.112694 | 0.01 | 11.2694 | 50.005 | 5.4735 | 0.01 | 547.35 | 50 |
| 0.042715 | 0.04 | 1.067875 | 50.03 | -10.201525 | 0.025 | -408.061 | 50.0175 |
| 0.017983 | 0.05 | 0.35966 | 50.075 | -0.708215 | 0.045 | -15.73811111 | 50.0525 |
| 0.017902 | 0.1 | 0.17902 | 50.15 | -0.18064 | 0.075 | -2.408533333 | 50.1125 |
| 0.010452 | 0.1 | 0.10452 | 50.25 | -0.0745 | 0.1 | -0.745 | 50.2 |
| 0.007409 | 0.1 | 0.07409 | 50.35 | -0.03043 | 0.1 | -0.3043 | 50.3 |
| 0.005746 | 0.1 | 0.05746 | 50.45 | -0.01663 | 0.1 | -0.1663 | 50.4 |
| 0.017837 | 0.5 | 0.035674 | 50.75 | -0.021786 | 0.3 | -0.07262 | 50.6 |
| 0.041391 | 4 | 0.010348 | 53 | -0.02532625 | 2.25 | -0.011256111 | 51.875 |
| 0.017823 | 5 | 0.003565 | 57.5 | -0.00678315 | 4.5 | -0.001507367 | 55.25 |
| 0.023559 | 15 | 0.001571 | 67.5 | -0.001994 | 10 | -0.0001994 | 62.5 |
| 0.012084 | 15 | 0.000806 | 82.5 | -0.000765 | 15 | -5.1E-05 | 75 |
First derivative curve:

Second derivative curve:

The volume at which the second-derivative curve cross zero correspond to the theoretical equivalence point. Theoretical equivalence point is 50.00 mL.At the maximum of the peak in the first derivative curve has a slope of zero. So, in the second derivative curve crosses the x axis at the point, corresponding to the equivalence point.
Want to see more full solutions like this?
Chapter 23 Solutions
Principles of Instrumental Analysis


- If I have 10 data points for variables x and y, when I represent y versus x I obtain a line with the equation y = mx + b. Is the slope m equal to dy/dx?arrow_forwardThe data for the potential difference of a battery and its temperature are given in the table. Calculate the entropy change in J mol-1 K-1 (indicate the formulas used).Data: F = 96485 C mol-1arrow_forwardIn a cell, the change in entropy (AS) can be calculated from the slope of the E° vs 1/T graph. The slope is equal to -AS/R, where R is the gas constant. Is this correct?arrow_forward
- Using the Arrhenius equation, it is possible to establish the relationship between the rate constant (k) of a chemical reaction and the temperature (T), in Kelvin (K), the universal gas constant (R), the pre-exponential factor (A) and the activation energy (Ea). This equation is widely applied in studies of chemical kinetics, and is also widely used to determine the activation energy of reactions. In this context, the following graph shows the variation of the rate constant with the inverse of the absolute temperature, for a given chemical reaction that obeys the Arrhenius equation. Based on the analysis of this graph and the concepts acquired about the kinetics of chemical reactions, analyze the following statements: I. The activation energy (Ea) varies with the temperature of the system. II. The activation energy (Ea) varies with the concentration of the reactants. III. The rate constant (K) varies proportionally with temperature. IV. The value of the…arrow_forwardIn an electrolytic cell, indicate the formula that relates E0 to the temperature T.arrow_forward-- 14:33 A Candidate Identification docs.google.com 11. Compound A can transform into compound B through an organic reaction. From the structures below, mark the correct one: HO A تھے۔ די HO B ○ A) Compounds A and B are isomers. B) Both have the same number of chiral carbons. C) Compound A underwent an addition reaction of Cl2 and H2O to form compound B. D) Compound A underwent a substitution reaction forming the intermediate chlorohydrin to obtain compound B. E) Compound A underwent an addition reaction of Cl2 forming the chloronium ion and then added methanol to obtain compound B. 60arrow_forward
- -- 14:40 A Candidate Identification docs.google.com 13. The compound 1-bromo-hex-2-ene reacts with methanol to form two products. About this reaction, mark the correct statement: OCH3 CH3OH Br OCH3 + + HBr A B A) The two products formed will have the same percentage of formation. B) Product B will be formed by SN1 substitution reaction with the formation of an allylic carbocation. C) Product A will be formed by SN1 substitution reaction with the formation of a more stable carbocation than product B. D) Product A will be formed by an SN2 substitution reaction occurring in two stages, the first with slow kinetics and the second with fast kinetics. E) The two compounds were obtained by addition reaction, with compound B having the highest percentage of formation. 57arrow_forward-- ☑ 14:30 A Candidate Identification docs.google.com 10. Amoxicillin (figure X) is one of the most widely used antibiotics in the penicillin family. The discovery and synthesis of these antibiotics in the 20th century made the treatment of infections that were previously fatal routine. About amoxicillin, mark the correct one: HO NH2 H S -N. HO Figura X. Amoxicilina A) It has the organic functions amide, ester, phenol and amine. B) It has four chiral carbons and 8 stereoisomers. C) The substitution of the aromatic ring is of the ortho-meta type. D) If amoxicillin reacts with an alcohol it can form an ester. E) The structure has two tertiary amides. 62arrow_forwardThe environmental police of a Brazilian state received a report of contamination of a river by inorganic arsenic, due to the excessive use of pesticides on a plantation on the riverbanks. Arsenic (As) is extremely toxic in its many forms and oxidation states. In nature, especially in groundwater, it is found in the form of arsenate (AsO ₄ ³ ⁻ ), which can be electrochemically reduced to As ⁰ and collected at the cathode of a coulometric cell. In this case, Potentiostatic Coulometry (at 25°C) was performed in an alkaline medium (pH = 7.5 throughout the analysis) to quantify the species. What potential (E) should have been selected/applied to perform the analysis, considering that this is an exhaustive electrolysis technique (until 99.99% of all AsO ₄ ³ ⁻ has been reduced to As ⁰ at the electrode, or n( final) = 0.01% n( initial )) and that the concentration of AsO ₄ ³ ⁻ found in the initial sample was 0.15 mmol/L ? Data: AsO ₄ 3 ⁻ (aq) + 2 H ₂ O ( l ) + 2 e ⁻ → A s O ₂ ⁻ ( a…arrow_forward
- -- 14:17 15. Water-soluble proteins are denatured when there is a change in the pH of the environment in which they are found. This occurs due to the protonation and deprotonation of functional groups present in their structure. Choose the option that indicates the chemical bonds modified by pH in the protein represented in the following figure. E CH2 C-OH CH2 H₂C H₁C CH CH3 CH3 CH CH₂-S-S-CH₂- 910 H B -CH2-CH2-CH2-CH₂-NH3* −0—C—CH₂- ○ A) A, C e D. • В) Вес ○ C) DeE ○ D) B, De E ○ E) A, B e C 68arrow_forwardSuppose sodium sulfate has been gradually added to 100 mL of a solution containing calcium ions and strontium ions, both at 0.15 mol/L. Indicate the alternative that presents the percentage of strontium ions that will have precipitated when the calcium sulfate begins to precipitate. Data: Kps of calcium sulfate: 2.4x10 ⁻ ⁵; Kps of strontium sulfate: 3.2x10 ⁻ ⁷ A) 20,2 % B) 36,6 % C) 62,9 % D) 87,5 % E) 98.7%arrow_forward14:43 A Candidate Identification docs.google.com 14. The following diagrams represent hypothetical membrane structures with their components numbered from 1 to 6. Based on the figures and your knowledge of biological membranes, select the correct alternative. | 3 5 || 人 2 500000 6 A) Structures 1, 3, 5, 2 and 4 are present in a constantly fluid arrangement that allows the selectivity of the movement ○ of molecules. Structure 4, present integrally or peripherally, is responsible for this selection, while the quantity of 6 regulates the fluidity. B) The membranes isolate the cell from the environment, but allow the passage of water-soluble molecules thanks to the presence of 2 and 3. The membrane in scheme is more fluid than that in 55arrow_forward

 Chemistry: The Molecular ScienceChemistryISBN:9781285199047Author:John W. Moore, Conrad L. StanitskiPublisher:Cengage Learning
 Principles of Instrumental AnalysisChemistryISBN:9781305577213Author:Douglas A. Skoog, F. James Holler, Stanley R. CrouchPublisher:Cengage Learning
 ChemistryChemistryISBN:9781305957404Author:Steven S. Zumdahl, Susan A. Zumdahl, Donald J. DeCostePublisher:Cengage Learning
 Chemistry: An Atoms First ApproachChemistryISBN:9781305079243Author:Steven S. Zumdahl, Susan A. ZumdahlPublisher:Cengage Learning