
Introduction to Probability and Statistics
14th Edition
ISBN: 9781133103752
Author: Mendenhall, William
Publisher: Cengage Learning
expand_more
expand_more
format_list_bulleted
Concept explainers
Videos
Textbook Question
Chapter 2.3, Problem 2.18E
Utility Bills in Southern CaliforniaThe monthly utility bills for a household in Riverside, California, were recorded for 12 consecutive months starting in January 2010: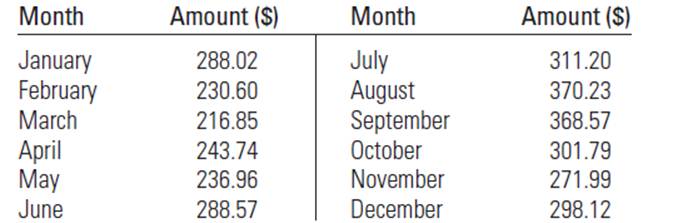
a. Calculate the
b. Calculate the average monthly utility bill for theyear 2010.
c. Calculate the standard deviation for the 2010 utilitybills.
Expert Solution & Answer
Want to see the full answer?
Check out a sample textbook solution
Students have asked these similar questions
65% of all violent felons in the prison system are repeat offenders. If 43 violent felons are randomly selected, find the probability that
a. Exactly 28 of them are repeat offenders.
b. At most 28 of them are repeat offenders. c. At least 28 of them are repeat offenders. d. Between 22 and 26 (including 22 and 26) of them are repeat offenders.
08:34
◄ Classroom
07:59
Probs. 5-32/33
D
ا.
89
5-34. Determine the horizontal and vertical components
of reaction at the pin A and the normal force at the smooth
peg B on the member.
A
0,4 m
0.4 m
Prob. 5-34
F=600 N
fr
th
ar
0.
163586
5-37. The wooden plank resting between the buildings
deflects slightly when it supports the 50-kg boy. This
deflection causes a triangular distribution of load at its ends.
having maximum intensities of w, and wg. Determine w
and wg. each measured in N/m. when the boy is standing
3 m from one end as shown. Neglect the mass of the plank.
0.45 m
3 m
Examine the Variables: Carefully review and note the names of all variables in the dataset. Examples of these variables include:
Mileage (mpg)
Number of Cylinders (cyl)
Displacement (disp)
Horsepower (hp)
Research: Google to understand these variables.
Statistical Analysis: Select mpg variable, and perform the following statistical tests. Once you are done with these tests using mpg variable, repeat the same with hp
Mean
Median
First Quartile (Q1)
Second Quartile (Q2)
Third Quartile (Q3)
Fourth Quartile (Q4)
10th Percentile
70th Percentile
Skewness
Kurtosis
Document Your Results:
In RStudio: Before running each statistical test, provide a heading in the format shown at the bottom. “# Mean of mileage – Your name’s command”
In Microsoft Word: Once you've completed all tests, take a screenshot of your results in RStudio and paste it into a Microsoft Word document. Make sure that snapshots are very clear. You will need multiple snapshots. Also transfer these results to the…
Chapter 2 Solutions
Introduction to Probability and Statistics
Ch. 2.2 - You are given n=5 measurements: 0, 5, 1, 1,3. Draw...Ch. 2.2 - Prob. 2.2ECh. 2.2 - Prob. 2.3ECh. 2.2 - Auto Insurance The cost of automobile insurance...Ch. 2.2 - Prob. 2.5ECh. 2.2 - Prob. 2.6ECh. 2.2 - Prob. 2.7ECh. 2.2 - Prob. 2.8ECh. 2.2 - Prob. 2.9ECh. 2.2 - Prob. 2.10E
Ch. 2.2 - Prob. 2.11ECh. 2.2 - Prob. 2.12ECh. 2.3 - You are given n=5 measurements: 2, 1, 1,3,5. a....Ch. 2.3 - Prob. 2.14ECh. 2.3 - Prob. 2.15ECh. 2.3 - Prob. 2.16ECh. 2.3 - Prob. 2.17ECh. 2.3 - Utility Bills in Southern CaliforniaThe monthly...Ch. 2.5 - Prob. 2.19ECh. 2.5 - Prob. 2.20ECh. 2.5 - A distribution of measurements is relatively...Ch. 2.5 - Prob. 2.22ECh. 2.5 - Prob. 2.23ECh. 2.5 - Packaging Hamburger Meat The data listed here are...Ch. 2.5 - Breathing Rates Is your breathing rate normal?...Ch. 2.5 - Prob. 2.26ECh. 2.5 - Social Security Numbers A group of70 students were...Ch. 2.5 - Prob. 2.28ECh. 2.5 - Prob. 2.29ECh. 2.5 - Prob. 2.30ECh. 2.5 - Timber Tracts To estimate the amount of lumber in...Ch. 2.5 - Prob. 2.32ECh. 2.5 - Prob. 2.33ECh. 2.5 - Prob. 2.34ECh. 2.5 - Prob. 2.35ECh. 2.5 - Prob. 2.36ECh. 2.5 - Prob. 2.37ECh. 2.5 - Prob. 2.38ECh. 2.5 - Prob. 2.39ECh. 2.7 - Prob. 2.40ECh. 2.7 - Find the five-number summary and the IQR forthese...Ch. 2.7 - Given the following data set: 2.3, 1.0, 2.1, 6.5,...Ch. 2.7 - Given the following data set: .23, .30, .35, .41,...Ch. 2.7 - Construct a box plot for these data and...Ch. 2.7 - Construct a box plot for these data and...Ch. 2.7 - If you scored at the 69th percentile on a...Ch. 2.7 - Mercury Concentration in DolphinsEnvironmental...Ch. 2.7 - Hamburger Meat The weights (in pounds) of the 27...Ch. 2.7 - Comparing NFL Quarterbacks How does Aaron Rodgers,...Ch. 2.7 - Presidential Vetoes The set of presidential vetoes...Ch. 2.7 - Survival Times Altman and Bland report the...Ch. 2.7 - Utility Bills in Southern California, again The...Ch. 2.7 - What’s Normal? again Refer to Exercise1.67 and...Ch. 2 - Raisins The number of raisins in each of...Ch. 2 - Prob. 2.55SECh. 2 - Prob. 2.56SECh. 2 - A Recurring IIIness Refer to Exercise 1.26 and...Ch. 2 - Prob. 2.58SECh. 2 - Prob. 2.59SECh. 2 - Tuna Fish, again Refer to Exercise 2.8. Theprices...Ch. 2 - Prob. 2.61SECh. 2 - Chloroform According to the EPA, Chloroform, which...Ch. 2 - Prob. 2.63SECh. 2 - Sleep and the College Student How muchsleep do you...Ch. 2 - Prob. 2.65SECh. 2 - Prob. 2.66SECh. 2 - Polluted Seawater Petroleum pollution in seasand...Ch. 2 - Prob. 2.68SECh. 2 - Prob. 2.69SECh. 2 - Prob. 2.70SECh. 2 - Prob. 2.71SECh. 2 - Prob. 2.72SECh. 2 - Prob. 2.73SECh. 2 - Prob. 2.74SECh. 2 - TV Commercials The mean duration oftelevision...Ch. 2 - Prob. 2.76SECh. 2 - Prob. 2.77SECh. 2 - Prob. 2.78SECh. 2 - Prob. 2.79SECh. 2 - Prob. 2.80SECh. 2 - Prob. 2.81SECh. 2 - Prob. 2.82SECh. 2 - Prob. 2.83SECh. 2 - Prob. 2.84SECh. 2 - Prob. 2.85SE
Knowledge Booster


Learn more about
Need a deep-dive on the concept behind this application? Look no further. Learn more about this topic, statistics and related others by exploring similar questions and additional content below.Similar questions
- Examine the Variables: Carefully review and note the names of all variables in the dataset. Examples of these variables include: Mileage (mpg) Number of Cylinders (cyl) Displacement (disp) Horsepower (hp) Research: Google to understand these variables. Statistical Analysis: Select mpg variable, and perform the following statistical tests. Once you are done with these tests using mpg variable, repeat the same with hp Mean Median First Quartile (Q1) Second Quartile (Q2) Third Quartile (Q3) Fourth Quartile (Q4) 10th Percentile 70th Percentile Skewness Kurtosis Document Your Results: In RStudio: Before running each statistical test, provide a heading in the format shown at the bottom. “# Mean of mileage – Your name’s command” In Microsoft Word: Once you've completed all tests, take a screenshot of your results in RStudio and paste it into a Microsoft Word document. Make sure that snapshots are very clear. You will need multiple snapshots. Also transfer these results to the…arrow_forwardExamine the Variables: Carefully review and note the names of all variables in the dataset. Examples of these variables include: Mileage (mpg) Number of Cylinders (cyl) Displacement (disp) Horsepower (hp) Research: Google to understand these variables. Statistical Analysis: Select mpg variable, and perform the following statistical tests. Once you are done with these tests using mpg variable, repeat the same with hp Mean Median First Quartile (Q1) Second Quartile (Q2) Third Quartile (Q3) Fourth Quartile (Q4) 10th Percentile 70th Percentile Skewness Kurtosis Document Your Results: In RStudio: Before running each statistical test, provide a heading in the format shown at the bottom. “# Mean of mileage – Your name’s command” In Microsoft Word: Once you've completed all tests, take a screenshot of your results in RStudio and paste it into a Microsoft Word document. Make sure that snapshots are very clear. You will need multiple snapshots. Also transfer these results to the…arrow_forward2 (VaR and ES) Suppose X1 are independent. Prove that ~ Unif[-0.5, 0.5] and X2 VaRa (X1X2) < VaRa(X1) + VaRa (X2). ~ Unif[-0.5, 0.5]arrow_forward
- 8 (Correlation and Diversification) Assume we have two stocks, A and B, show that a particular combination of the two stocks produce a risk-free portfolio when the correlation between the return of A and B is -1.arrow_forward9 (Portfolio allocation) Suppose R₁ and R2 are returns of 2 assets and with expected return and variance respectively r₁ and 72 and variance-covariance σ2, 0%½ and σ12. Find −∞ ≤ w ≤ ∞ such that the portfolio wR₁ + (1 - w) R₂ has the smallest risk.arrow_forward7 (Multivariate random variable) Suppose X, €1, €2, €3 are IID N(0, 1) and Y2 Y₁ = 0.2 0.8X + €1, Y₂ = 0.3 +0.7X+ €2, Y3 = 0.2 + 0.9X + €3. = (In models like this, X is called the common factors of Y₁, Y₂, Y3.) Y = (Y1, Y2, Y3). (a) Find E(Y) and cov(Y). (b) What can you observe from cov(Y). Writearrow_forward
- 1 (VaR and ES) Suppose X ~ f(x) with 1+x, if 0> x > −1 f(x) = 1−x if 1 x > 0 Find VaRo.05 (X) and ES0.05 (X).arrow_forwardJoy is making Christmas gifts. She has 6 1/12 feet of yarn and will need 4 1/4 to complete our project. How much yarn will she have left over compute this solution in two different ways arrow_forwardSolve for X. Explain each step. 2^2x • 2^-4=8arrow_forward
- One hundred people were surveyed, and one question pertained to their educational background. The results of this question and their genders are given in the following table. Female (F) Male (F′) Total College degree (D) 30 20 50 No college degree (D′) 30 20 50 Total 60 40 100 If a person is selected at random from those surveyed, find the probability of each of the following events.1. The person is female or has a college degree. Answer: equation editor Equation Editor 2. The person is male or does not have a college degree. Answer: equation editor Equation Editor 3. The person is female or does not have a college degree.arrow_forwardneed help with part barrow_forwardSuppose you know that Bob's test score is above the mean, but he doesn't remember by how much. At least how many students must score lower than Bob?arrow_forward
arrow_back_ios
SEE MORE QUESTIONS
arrow_forward_ios
Recommended textbooks for you
 Big Ideas Math A Bridge To Success Algebra 1: Stu...AlgebraISBN:9781680331141Author:HOUGHTON MIFFLIN HARCOURTPublisher:Houghton Mifflin Harcourt
 Glencoe Algebra 1, Student Edition, 9780079039897...AlgebraISBN:9780079039897Author:CarterPublisher:McGraw Hill
 Holt Mcdougal Larson Pre-algebra: Student Edition...AlgebraISBN:9780547587776Author:HOLT MCDOUGALPublisher:HOLT MCDOUGAL
Big Ideas Math A Bridge To Success Algebra 1: Stu...
Algebra
ISBN:9781680331141
Author:HOUGHTON MIFFLIN HARCOURT
Publisher:Houghton Mifflin Harcourt
Glencoe Algebra 1, Student Edition, 9780079039897...
Algebra
ISBN:9780079039897
Author:Carter
Publisher:McGraw Hill
Holt Mcdougal Larson Pre-algebra: Student Edition...
Algebra
ISBN:9780547587776
Author:HOLT MCDOUGAL
Publisher:HOLT MCDOUGAL
The Shape of Data: Distributions: Crash Course Statistics #7; Author: CrashCourse;https://www.youtube.com/watch?v=bPFNxD3Yg6U;License: Standard YouTube License, CC-BY
Shape, Center, and Spread - Module 20.2 (Part 1); Author: Mrmathblog;https://www.youtube.com/watch?v=COaid7O_Gag;License: Standard YouTube License, CC-BY
Shape, Center and Spread; Author: Emily Murdock;https://www.youtube.com/watch?v=_YyW0DSCzpM;License: Standard Youtube License