Introduction to Probability and Statistics
14th Edition
ISBN: 9781133103752
Author: Mendenhall, William
Publisher: Cengage Learning
bartleby

Concept explainers

bartleby

Videos

Question
Book Icon
Chapter 2.5, Problem 2.34E

a.

To determine

To find:The relative frequency histogram for the data.

a.

Expert Solution
Check Mark

Answer to Problem 2.34E

The relative frequency histogram for the datais shown in Figure-1.

Explanation of Solution

Given information: The data is,

    Washington0Van Buren4Buchanan0
    Adams5W.H. Harrison10Lincoln4
    Jefferson6Tyler*15A. Johnson5
    Madison0Polk0Grant4
    Monroe2Taylor6Hayes8
    JO. Adams4Fillmore*2Garfield7
    Jackson0Pierce3Arthur3
    Cleveland5Coolidge2Nixon2
    B. Harrison*3Hoover2Ford4
    McKinley2F.D.Roosevelt6Carter4
    T. Roosevelt*6Truman1Reagan*4
    Taft3Eisenhower2G.H.W. Bush6
    Wilson*3Kennedy3Clinton1
    Harding0L.B.Johmson2G.W. Bush2
    Obama2

Calculation:

The histogram is shown below.
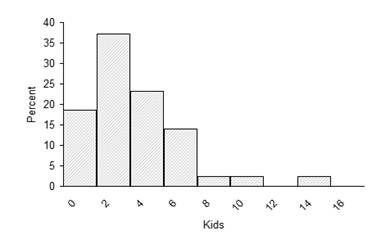
  Introduction to Probability and Statistics, Chapter 2.5, Problem 2.34E

Figure-1

Thus, the relative frequency histogram for the data is shown in Figure-1.

b.

To determine

To find: The mean and standard deviation.

b.

Expert Solution
Check Mark

Answer to Problem 2.34E

The mean and standard deviation is 3.5582 and 2.9139 .

Explanation of Solution

Given information: The data is,

    Washington0Van Buren4Buchanan0
    Adams5W.H. Harrison10Lincoln4
    Jefferson6Tyler*15A. Johnson5
    Madison0Polk0Grant4
    Monroe2Taylor6Hayes8
    JO. Adams4Fillmore*2Garfield7
    Jackson0Pierce3Arthur3
    Cleveland5Coolidge2Nixon2
    B. Harrison*3Hoover2Ford4
    McKinley2F.D.Roosevelt6Carter4
    T. Roosevelt*6Truman1Reagan*4
    Taft3Eisenhower2G.H.W. Bush6
    Wilson*3Kennedy3Clinton1
    Harding0L.B.Johmson2G.W. Bush2
    Obama2

Calculation:

The mean is,

  x¯=xn=15343=3.5582

The variance is,

  s2=1n1[ x i 2 ( x ) 2n]=1431[901 ( 153 ) 243]=8.4906

The standard deviation is,

  s=8.4906=2.9139

Thus, the mean and standard deviation is 3.5582 and 2.9139 .

c.

To determine

To find: The percentage falling into the given intervals.

c.

Expert Solution
Check Mark

Answer to Problem 2.34E

The percentage falling into the given intervalsis 95% and 99.7% .

Explanation of Solution

Given information: The data is,

    Washington0Van Buren4Buchanan0
    Adams5W.H. Harrison10Lincoln4
    Jefferson6Tyler*15A. Johnson5
    Madison0Polk0Grant4
    Monroe2Taylor6Hayes8
    JO. Adams4Fillmore*2Garfield7
    Jackson0Pierce3Arthur3
    Cleveland5Coolidge2Nixon2
    B. Harrison*3Hoover2Ford4
    McKinley2F.D.Roosevelt6Carter4
    T. Roosevelt*6Truman1Reagan*4
    Taft3Eisenhower2G.H.W. Bush6
    Wilson*3Kennedy3Clinton1
    Harding0L.B.Johmson2G.W. Bush2
    Obama2

Calculation:

The interval is,

  (x¯±s)=3.5582±2.9139=(0.6443,6.4721)

The measurement falling into the intervals are 33.

The interval is,

  (x¯±2s)=3.5582±2×2.9139=(2.2696,9.386)

The measurement falling into the intervals are 41.

The interval is,

  (x¯±3s)=3.5582±3×2.9139=(5.1835,12.2999)

The measurement falling into the intervals are 42.

According to the Empirical formula the percentage of values falling into the intervals are 95% and 99.7%

Thus, the percentage falling into the given intervals is 95% and 99.7% .

Want to see more full solutions like this?

Subscribe now to access step-by-step solutions to millions of textbook problems written by subject matter experts!
Students have asked these similar questions
Hi, I need to make sure I have drafted a thorough analysis, so please answer the following questions. Based on the data in the attached image, develop a regression model to forecast the average sales of football magazines for each of the seven home games in the upcoming season (Year 10). That is, you should construct a single regression model and use it to estimate the average demand for the seven home games in Year 10. In addition to the variables provided, you may create new variables based on these variables or based on observations of your analysis. Be sure to provide a thorough analysis of your final model (residual diagnostics) and provide assessments of its accuracy. What insights are available based on your regression model?
I want to make sure that I included all possible variables and observations. There is a considerable amount of data in the images below, but not all of it may be useful for your purposes. Are there variables contained in the file that you would exclude from a forecast model to determine football magazine sales in Year 10? If so, why? Are there particular observations of football magazine sales from previous years that you would exclude from your forecasting model? If so, why?
Stat questions

Chapter 2 Solutions

Introduction to Probability and Statistics

Ch. 2.2 - Prob. 2.11ECh. 2.2 - Prob. 2.12ECh. 2.3 - You are given n=5 measurements: 2, 1, 1,3,5. a....Ch. 2.3 - Prob. 2.14ECh. 2.3 - Prob. 2.15ECh. 2.3 - Prob. 2.16ECh. 2.3 - Prob. 2.17ECh. 2.3 - Utility Bills in Southern CaliforniaThe monthly...Ch. 2.5 - Prob. 2.19ECh. 2.5 - Prob. 2.20ECh. 2.5 - A distribution of measurements is relatively...Ch. 2.5 - Prob. 2.22ECh. 2.5 - Prob. 2.23ECh. 2.5 - Packaging Hamburger Meat The data listed here are...Ch. 2.5 - Breathing Rates Is your breathing rate normal?...Ch. 2.5 - Prob. 2.26ECh. 2.5 - Social Security Numbers A group of70 students were...Ch. 2.5 - Prob. 2.28ECh. 2.5 - Prob. 2.29ECh. 2.5 - Prob. 2.30ECh. 2.5 - Timber Tracts To estimate the amount of lumber in...Ch. 2.5 - Prob. 2.32ECh. 2.5 - Prob. 2.33ECh. 2.5 - Prob. 2.34ECh. 2.5 - Prob. 2.35ECh. 2.5 - Prob. 2.36ECh. 2.5 - Prob. 2.37ECh. 2.5 - Prob. 2.38ECh. 2.5 - Prob. 2.39ECh. 2.7 - Prob. 2.40ECh. 2.7 - Find the five-number summary and the IQR forthese...Ch. 2.7 - Given the following data set: 2.3, 1.0, 2.1, 6.5,...Ch. 2.7 - Given the following data set: .23, .30, .35, .41,...Ch. 2.7 - Construct a box plot for these data and...Ch. 2.7 - Construct a box plot for these data and...Ch. 2.7 - If you scored at the 69th percentile on a...Ch. 2.7 - Mercury Concentration in DolphinsEnvironmental...Ch. 2.7 - Hamburger Meat The weights (in pounds) of the 27...Ch. 2.7 - Comparing NFL Quarterbacks How does Aaron Rodgers,...Ch. 2.7 - Presidential Vetoes The set of presidential vetoes...Ch. 2.7 - Survival Times Altman and Bland report the...Ch. 2.7 - Utility Bills in Southern California, again The...Ch. 2.7 - What’s Normal? again Refer to Exercise1.67 and...Ch. 2 - Raisins The number of raisins in each of...Ch. 2 - Prob. 2.55SECh. 2 - Prob. 2.56SECh. 2 - A Recurring IIIness Refer to Exercise 1.26 and...Ch. 2 - Prob. 2.58SECh. 2 - Prob. 2.59SECh. 2 - Tuna Fish, again Refer to Exercise 2.8. Theprices...Ch. 2 - Prob. 2.61SECh. 2 - Chloroform According to the EPA, Chloroform, which...Ch. 2 - Prob. 2.63SECh. 2 - Sleep and the College Student How muchsleep do you...Ch. 2 - Prob. 2.65SECh. 2 - Prob. 2.66SECh. 2 - Polluted Seawater Petroleum pollution in seasand...Ch. 2 - Prob. 2.68SECh. 2 - Prob. 2.69SECh. 2 - Prob. 2.70SECh. 2 - Prob. 2.71SECh. 2 - Prob. 2.72SECh. 2 - Prob. 2.73SECh. 2 - Prob. 2.74SECh. 2 - TV Commercials The mean duration oftelevision...Ch. 2 - Prob. 2.76SECh. 2 - Prob. 2.77SECh. 2 - Prob. 2.78SECh. 2 - Prob. 2.79SECh. 2 - Prob. 2.80SECh. 2 - Prob. 2.81SECh. 2 - Prob. 2.82SECh. 2 - Prob. 2.83SECh. 2 - Prob. 2.84SECh. 2 - Prob. 2.85SE
Knowledge Booster
Background pattern image
Statistics
Learn more about
Need a deep-dive on the concept behind this application? Look no further. Learn more about this topic, statistics and related others by exploring similar questions and additional content below.
Similar questions
SEE MORE QUESTIONS
Recommended textbooks for you
Text book image
Holt Mcdougal Larson Pre-algebra: Student Edition...
Algebra
ISBN:9780547587776
Author:HOLT MCDOUGAL
Publisher:HOLT MCDOUGAL
Text book image
Big Ideas Math A Bridge To Success Algebra 1: Stu...
Algebra
ISBN:9781680331141
Author:HOUGHTON MIFFLIN HARCOURT
Publisher:Houghton Mifflin Harcourt
Text book image
Glencoe Algebra 1, Student Edition, 9780079039897...
Algebra
ISBN:9780079039897
Author:Carter
Publisher:McGraw Hill
Text book image
Algebra: Structure And Method, Book 1
Algebra
ISBN:9780395977224
Author:Richard G. Brown, Mary P. Dolciani, Robert H. Sorgenfrey, William L. Cole
Publisher:McDougal Littell
Continuous Probability Distributions - Basic Introduction; Author: The Organic Chemistry Tutor;https://www.youtube.com/watch?v=QxqxdQ_g2uw;License: Standard YouTube License, CC-BY
Probability Density Function (p.d.f.) Finding k (Part 1) | ExamSolutions; Author: ExamSolutions;https://www.youtube.com/watch?v=RsuS2ehsTDM;License: Standard YouTube License, CC-BY
Find the value of k so that the Function is a Probability Density Function; Author: The Math Sorcerer;https://www.youtube.com/watch?v=QqoCZWrVnbA;License: Standard Youtube License