
Videos
(a)
To find: A new data set that has Internet users as users per 10,000 people and births as births per 10,000 people.
(a)
Answer to Problem 36E
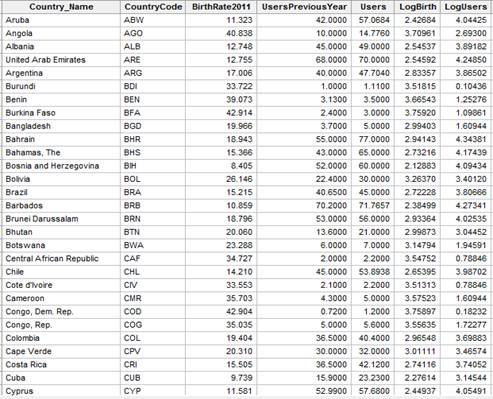
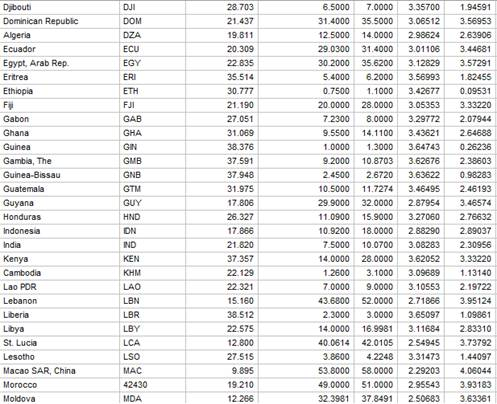
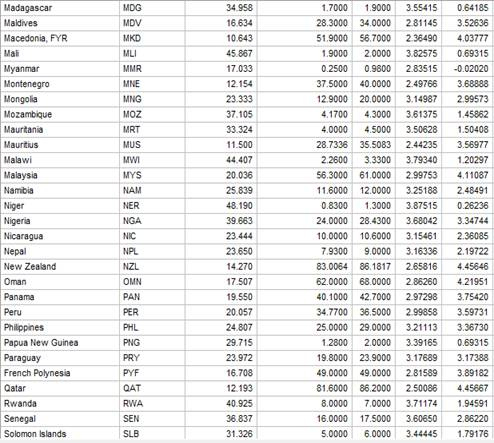
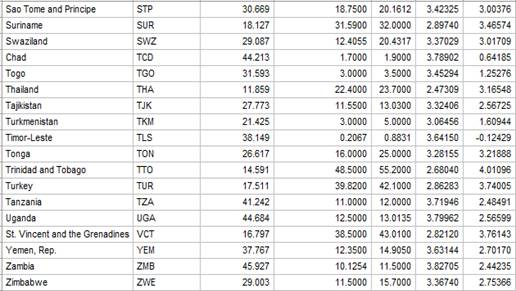
Solution: The partial data set is shown below:
Country Name |
Country Code |
Birth rate |
Users Per 100 |
Users per 10000 |
Birth per 10000 |
Aruba |
ABW |
11.323 |
57.0684 |
5706.84 |
113.23 |
Angola |
AGO |
40.838 |
14.776 |
1477.6 |
408.38 |
Albania |
ALB |
12.748 |
49.00 |
4900 |
127.48 |
United Arab Emirates |
ARE |
12.755 |
70.00 |
7000 |
127.55 |
Argentina |
ARG |
17.006 |
47.7040 |
4770.4 |
170.06 |
Burundi |
BDI |
33.722 |
1.11 |
111 |
337.22 |
Benin |
BEN |
39.073 |
3.50 |
350 |
390.73 |
Explanation of Solution
Given: The data of birthrate (births per 1000 people) versus Internet use (users per 100 people) for 106 countries is given below.
Calculation: To obtain a new data set that has Internet users as users per 10,000 people and births as births per 10,000 people use Minitab. Follow the steps below:
Step 1: Open the Minitab worksheet which contains the data.
Step 2: Go to Calc > Calculator.
Step 3: Write “Users per 10000” in the column for Store result in variable. Select Users in the column for Expression and select “&*#8221; from the calculator and write
Step 4: Click OK.
The new data set for users for 10,000 people is obtained. To obtain the new data set for Birthrate 2011 for 10,000 people follow the similar steps.
Step 1: Open the Minitab worksheet which contains the data.
Step 2: Go to Calc > Calculator.
Step 3: Write “Birth rate per 10000”in the column for Store result in variable. Select Birthrate 2011 in the column for Expression and select “&*#8221; from the calculator and write
Step 4: Click OK.
The new data set for Birthrate 2011 for 10,000 people is obtained. The partial data set is shown below:
Country Name |
Country Code |
Birth rate |
Users |
Users per 10000 |
Birth per 10000 |
Aruba |
ABW |
11.323 |
57.0684 |
5706.84 |
113.23 |
Angola |
AGO |
40.838 |
14.7760 |
1477.60 |
408.38 |
Albania |
ALB |
12.748 |
49.0000 |
4900.00 |
127.48 |
United Arab Emirates |
ARE |
12.755 |
70.0000 |
7000.00 |
127.55 |
Argentina |
ARG |
17.006 |
47.7040 |
4770.40 |
170.06 |
Burundi |
BDI |
33.722 |
1.1100 |
111.00 |
337.22 |
Benin |
BEN |
39.073 |
3.5000 |
350.00 |
390.73 |
(b)
To explain: The reason for these transformations to be linear transformations.
(b)
Answer to Problem 36E
Solution: These transformations are linear transformations because every variable is multiplied by a numerical value.
Explanation of Solution
(c)
To graph: A
(c)
Explanation of Solution
Graph: To obtain the scatterplot use Minitab. Follow the steps below:
Step 1: Go to Stat > Graph > Scatterplot > Simple.
Step 2: Select “Birth per 10,000” in Y variables and “Users per 10,000” in X variables.
Step 3: Click OK.
The required scatterplot is obtained as:
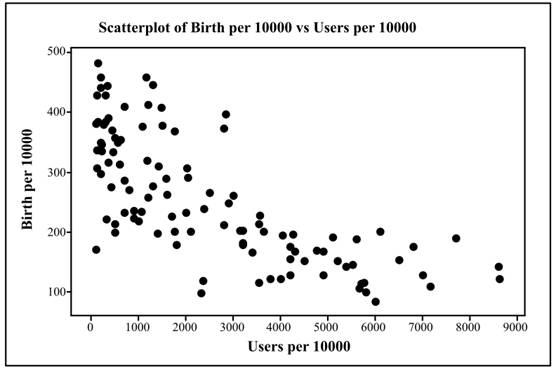
Interpretation: The scatterplot represents that the relationship between numbers of births per10,000 versus Internet users per 10,000 is negative.
(d)
To explain: The comparison between obtained scatterplot and figure 2.13.
(d)
Answer to Problem 36E
Solution: The obtained scatterplot in part (c) represents that the relationship between variables is more linear than the relationship which is represented by the scatterplot of births per 1000 people and internet users per 100 people. Both the scatterplots shows moderate relationship between the variables.
Explanation of Solution
The scatterplot of births per 1000 people and internet users per 100 people is shown below:
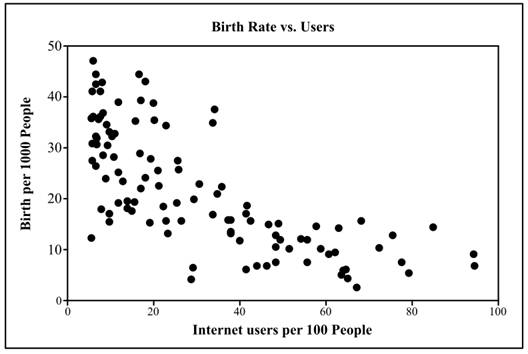
The scatterplot represents that the relationship between births per 1000 people versus Internet users per 100 people for 106 countries is quite linear and negative. The scatterplot which is obtained in part (c) represents that the relationship between birth rate per 10000 people and internet users per 10000 people is more linear than the provided scatterplot. Both the scatterplot show a moderate relationship between the variables.
(e)
To explain: The reason why World Bank selected Internet users as users per 100 people and births as births per 1000 people.
(e)
Answer to Problem 36E
Solution: To make the proper ratio, the analyst of World Bank selected Internet users as users per 100 people and births as births per 1000 people.
Explanation of Solution
Want to see more full solutions like this?
Chapter 2 Solutions
Introduction to the Practice of Statistics


- Q.2.1 A bag contains 13 red and 9 green marbles. You are asked to select two (2) marbles from the bag. The first marble selected will not be placed back into the bag. Q.2.1.1 Construct a probability tree to indicate the various possible outcomes and their probabilities (as fractions). Q.2.1.2 What is the probability that the two selected marbles will be the same colour? Q.2.2 The following contingency table gives the results of a sample survey of South African male and female respondents with regard to their preferred brand of sports watch: PREFERRED BRAND OF SPORTS WATCH Samsung Apple Garmin TOTAL No. of Females 30 100 40 170 No. of Males 75 125 80 280 TOTAL 105 225 120 450 Q.2.2.1 What is the probability of randomly selecting a respondent from the sample who prefers Garmin? Q.2.2.2 What is the probability of randomly selecting a respondent from the sample who is not female? Q.2.2.3 What is the probability of randomly…arrow_forwardTest the claim that a student's pulse rate is different when taking a quiz than attending a regular class. The mean pulse rate difference is 2.7 with 10 students. Use a significance level of 0.005. Pulse rate difference(Quiz - Lecture) 2 -1 5 -8 1 20 15 -4 9 -12arrow_forwardThe following ordered data list shows the data speeds for cell phones used by a telephone company at an airport: A. Calculate the Measures of Central Tendency from the ungrouped data list. B. Group the data in an appropriate frequency table. C. Calculate the Measures of Central Tendency using the table in point B. D. Are there differences in the measurements obtained in A and C? Why (give at least one justified reason)? I leave the answers to A and B to resolve the remaining two. 0.8 1.4 1.8 1.9 3.2 3.6 4.5 4.5 4.6 6.2 6.5 7.7 7.9 9.9 10.2 10.3 10.9 11.1 11.1 11.6 11.8 12.0 13.1 13.5 13.7 14.1 14.2 14.7 15.0 15.1 15.5 15.8 16.0 17.5 18.2 20.2 21.1 21.5 22.2 22.4 23.1 24.5 25.7 28.5 34.6 38.5 43.0 55.6 71.3 77.8 A. Measures of Central Tendency We are to calculate: Mean, Median, Mode The data (already ordered) is: 0.8, 1.4, 1.8, 1.9, 3.2, 3.6, 4.5, 4.5, 4.6, 6.2, 6.5, 7.7, 7.9, 9.9, 10.2, 10.3, 10.9, 11.1, 11.1, 11.6, 11.8, 12.0, 13.1, 13.5, 13.7, 14.1, 14.2, 14.7, 15.0, 15.1, 15.5,…arrow_forward
- PEER REPLY 1: Choose a classmate's Main Post. 1. Indicate a range of values for the independent variable (x) that is reasonable based on the data provided. 2. Explain what the predicted range of dependent values should be based on the range of independent values.arrow_forwardIn a company with 80 employees, 60 earn $10.00 per hour and 20 earn $13.00 per hour. Is this average hourly wage considered representative?arrow_forwardThe following is a list of questions answered correctly on an exam. Calculate the Measures of Central Tendency from the ungrouped data list. NUMBER OF QUESTIONS ANSWERED CORRECTLY ON AN APTITUDE EXAM 112 72 69 97 107 73 92 76 86 73 126 128 118 127 124 82 104 132 134 83 92 108 96 100 92 115 76 91 102 81 95 141 81 80 106 84 119 113 98 75 68 98 115 106 95 100 85 94 106 119arrow_forward
- The following ordered data list shows the data speeds for cell phones used by a telephone company at an airport: A. Calculate the Measures of Central Tendency using the table in point B. B. Are there differences in the measurements obtained in A and C? Why (give at least one justified reason)? 0.8 1.4 1.8 1.9 3.2 3.6 4.5 4.5 4.6 6.2 6.5 7.7 7.9 9.9 10.2 10.3 10.9 11.1 11.1 11.6 11.8 12.0 13.1 13.5 13.7 14.1 14.2 14.7 15.0 15.1 15.5 15.8 16.0 17.5 18.2 20.2 21.1 21.5 22.2 22.4 23.1 24.5 25.7 28.5 34.6 38.5 43.0 55.6 71.3 77.8arrow_forwardIn a company with 80 employees, 60 earn $10.00 per hour and 20 earn $13.00 per hour. a) Determine the average hourly wage. b) In part a), is the same answer obtained if the 60 employees have an average wage of $10.00 per hour? Prove your answer.arrow_forwardThe following ordered data list shows the data speeds for cell phones used by a telephone company at an airport: A. Calculate the Measures of Central Tendency from the ungrouped data list. B. Group the data in an appropriate frequency table. 0.8 1.4 1.8 1.9 3.2 3.6 4.5 4.5 4.6 6.2 6.5 7.7 7.9 9.9 10.2 10.3 10.9 11.1 11.1 11.6 11.8 12.0 13.1 13.5 13.7 14.1 14.2 14.7 15.0 15.1 15.5 15.8 16.0 17.5 18.2 20.2 21.1 21.5 22.2 22.4 23.1 24.5 25.7 28.5 34.6 38.5 43.0 55.6 71.3 77.8arrow_forward
- Businessarrow_forwardhttps://www.hawkeslearning.com/Statistics/dbs2/datasets.htmlarrow_forwardNC Current Students - North Ce X | NC Canvas Login Links - North ( X Final Exam Comprehensive x Cengage Learning x WASTAT - Final Exam - STAT → C webassign.net/web/Student/Assignment-Responses/submit?dep=36055360&tags=autosave#question3659890_9 Part (b) Draw a scatter plot of the ordered pairs. N Life Expectancy Life Expectancy 80 70 600 50 40 30 20 10 Year of 1950 1970 1990 2010 Birth O Life Expectancy Part (c) 800 70 60 50 40 30 20 10 1950 1970 1990 W ALT 林 $ # 4 R J7 Year of 2010 Birth F6 4+ 80 70 60 50 40 30 20 10 Year of 1950 1970 1990 2010 Birth Life Expectancy Ox 800 70 60 50 40 30 20 10 Year of 1950 1970 1990 2010 Birth hp P.B. KA & 7 80 % 5 H A B F10 711 N M K 744 PRT SC ALT CTRLarrow_forward
 MATLAB: An Introduction with ApplicationsStatisticsISBN:9781119256830Author:Amos GilatPublisher:John Wiley & Sons Inc
 Probability and Statistics for Engineering and th...StatisticsISBN:9781305251809Author:Jay L. DevorePublisher:Cengage Learning
 Statistics for The Behavioral Sciences (MindTap C...StatisticsISBN:9781305504912Author:Frederick J Gravetter, Larry B. WallnauPublisher:Cengage Learning
 Elementary Statistics: Picturing the World (7th E...StatisticsISBN:9780134683416Author:Ron Larson, Betsy FarberPublisher:PEARSON
 The Basic Practice of StatisticsStatisticsISBN:9781319042578Author:David S. Moore, William I. Notz, Michael A. FlignerPublisher:W. H. Freeman
 Introduction to the Practice of StatisticsStatisticsISBN:9781319013387Author:David S. Moore, George P. McCabe, Bruce A. CraigPublisher:W. H. Freeman