
Statistics for Business & Economics, Revised (MindTap Course List)
12th Edition
ISBN: 9781285846323
Author: David R. Anderson, Dennis J. Sweeney, Thomas A. Williams, Jeffrey D. Camm, James J. Cochran
Publisher: South-Western College Pub
expand_more
expand_more
format_list_bulleted
Concept explainers
Videos
Textbook Question
Chapter 21.3, Problem 13E
Lawson’s Department Store faces a buying decision for a seasonal product for which demand can be high, medium, or low. The purchaser for Lawson’s can order 1, 2, or 3 lots of the product before the season begins but cannot reorder later. Profit projections (in thousands of dollars) are shown.
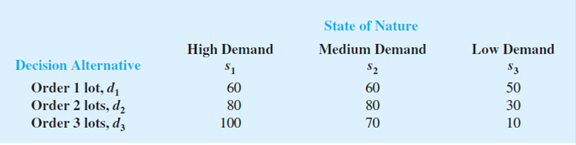
- a. If the prior probabilities for the three states of nature are .3, .3, and .4, respectively, what is the recommended order quantity?
- b. At each preseason sales meeting, the vice president of sales provides a personal opinion regarding potential demand for this product. Because of the vice president’s enthusiasm and optimistic nature, the predictions of market conditions have always been either “excellent” (E) or “very good” (V). Probabilities are as follows. What is the optimal decision strategy?
| P(E) = .7 | P(s1 | E ) = .34 | P(s1 | V ) = .20 |
| P(V) = .3 | P(s2 | E ) = .32 | P(s2 | V) = .26 |
| P(s3 | E) = .34 | P(s3 | V) = .54 |
- c. Compute EVPI and EVSI. Discuss whether the firm should consider a consulting expert who could provide independent forecasts of market conditions for the product.
Expert Solution & Answer

Trending nowThis is a popular solution!

Students have asked these similar questions
Microsoft Excel include formulas
Question 1
The data shown in Table 1 are and R values for 24 samples of size n = 5 taken from a process producing
bearings. The measurements are made on the inside diameter of the bearing, with only the last three decimals
recorded (i.e., 34.5 should be 0.50345).
Table 1: Bearing Diameter Data
Sample Number
I
R
Sample Number
I R
1
34.5
3
13
35.4
8
2
34.2
4
14
34.0
6
3
31.6
4
15
37.1
5
4
31.5
4
16
34.9
7
5
35.0
5
17
33.5
4
6
34.1
6
18
31.7
3
7
32.6
4
19
34.0
8
8
33.8
3
20
35.1
9
34.8
7
21
33.7
2
10
33.6
8
22
32.8
1
11
31.9
3
23
33.5
3
12
38.6 9
24
34.2
2
(a) Set up and R charts on this process. Does the process seem to be in statistical control? If necessary,
revise the trial control limits. [15 pts]
(b) If specifications on this diameter are 0.5030±0.0010, find the percentage of nonconforming bearings pro-
duced by this process. Assume that diameter is normally distributed. [10 pts]
1
4. (5 pts) Conduct a chi-square contingency test (test of independence) to assess whether
there is an association between the behavior of the elderly person (did not stop to talk,
did stop to talk) and their likelihood of falling. Below, please state your null and
alternative hypotheses, calculate your expected values and write them in the table,
compute the test statistic, test the null by comparing your test statistic to the critical
value in Table A (p. 713-714) of your textbook and/or estimating the P-value, and
provide your conclusions in written form. Make sure to show your work.
Did not stop walking to talk
Stopped walking to talk
Suffered a fall
12
11
Totals
23
Did not suffer a fall | 2
Totals
35
37
14
46
60
T
Chapter 21 Solutions
Statistics for Business & Economics, Revised (MindTap Course List)
Ch. 21.2 - Prob. 1ECh. 21.2 - A decision maker faced with four decision...Ch. 21.2 - Hudson Corporation is considering three options...Ch. 21.2 - Myrtle Air Express decided to offer direct service...Ch. 21.2 - The distance from Potsdam to larger markets and...Ch. 21.2 - Seneca Hill Winery recently purchased land for the...Ch. 21.2 - The Lake Placid Town Council has decided to build...Ch. 21.3 - Consider a variation of the PDC decision tree...Ch. 21.3 - A real estate investor has the opportunity to...Ch. 21.3 - Dante Development Corporation is considering...
Ch. 21.3 - Hales TV Productions is considering producing a...Ch. 21.3 - Martins Service Station is considering entering...Ch. 21.3 - Lawsons Department Store faces a buying decision...Ch. 21.4 - Suppose that you are given a decision situation...Ch. 21.4 - In the following profit payoff table for a...Ch. 21.4 - To save on expenses, Rona and Jerry agreed to form...Ch. 21.4 - The Gorman Manufacturing Company must decide...Ch. 21 - An investor wants to select one of seven mutual...Ch. 21 - Warren Lloyd is interested in leasing a new car...Ch. 21 - Hemmingway, Inc. is considering a 50 million...Ch. 21 - Embassy Publishing Company received a six-chapter...Ch. 21 - Lawsuit Defense Strategy John Campbell, an...
Knowledge Booster


Learn more about
Need a deep-dive on the concept behind this application? Look no further. Learn more about this topic, statistics and related others by exploring similar questions and additional content below.Similar questions
- Question 2 Parts manufactured by an injection molding process are subjected to a compressive strength test. Twenty samples of five parts each are collected, and the compressive strengths (in psi) are shown in Table 2. Table 2: Strength Data for Question 2 Sample Number x1 x2 23 x4 x5 R 1 83.0 2 88.6 78.3 78.8 3 85.7 75.8 84.3 81.2 78.7 75.7 77.0 71.0 84.2 81.0 79.1 7.3 80.2 17.6 75.2 80.4 10.4 4 80.8 74.4 82.5 74.1 75.7 77.5 8.4 5 83.4 78.4 82.6 78.2 78.9 80.3 5.2 File Preview 6 75.3 79.9 87.3 89.7 81.8 82.8 14.5 7 74.5 78.0 80.8 73.4 79.7 77.3 7.4 8 79.2 84.4 81.5 86.0 74.5 81.1 11.4 9 80.5 86.2 76.2 64.1 80.2 81.4 9.9 10 75.7 75.2 71.1 82.1 74.3 75.7 10.9 11 80.0 81.5 78.4 73.8 78.1 78.4 7.7 12 80.6 81.8 79.3 73.8 81.7 79.4 8.0 13 82.7 81.3 79.1 82.0 79.5 80.9 3.6 14 79.2 74.9 78.6 77.7 75.3 77.1 4.3 15 85.5 82.1 82.8 73.4 71.7 79.1 13.8 16 78.8 79.6 80.2 79.1 80.8 79.7 2.0 17 82.1 78.2 18 84.5 76.9 75.5 83.5 81.2 19 79.0 77.8 20 84.5 73.1 78.2 82.1 79.2 81.1 7.6 81.2 84.4 81.6 80.8…arrow_forwardName: Lab Time: Quiz 7 & 8 (Take Home) - due Wednesday, Feb. 26 Contingency Analysis (Ch. 9) In lab 5, part 3, you will create a mosaic plot and conducted a chi-square contingency test to evaluate whether elderly patients who did not stop walking to talk (vs. those who did stop) were more likely to suffer a fall in the next six months. I have tabulated the data below. Answer the questions below. Please show your calculations on this or a separate sheet. Did not stop walking to talk Stopped walking to talk Totals Suffered a fall Did not suffer a fall Totals 12 11 23 2 35 37 14 14 46 60 Quiz 7: 1. (2 pts) Compute the odds of falling for each group. Compute the odds ratio for those who did not stop walking vs. those who did stop walking. Interpret your result verbally.arrow_forwardSolve please and thank you!arrow_forward
- 7. In a 2011 article, M. Radelet and G. Pierce reported a logistic prediction equation for the death penalty verdicts in North Carolina. Let Y denote whether a subject convicted of murder received the death penalty (1=yes), for the defendant's race h (h1, black; h = 2, white), victim's race i (i = 1, black; i = 2, white), and number of additional factors j (j = 0, 1, 2). For the model logit[P(Y = 1)] = a + ß₁₂ + By + B²², they reported = -5.26, D â BD = 0, BD = 0.17, BY = 0, BY = 0.91, B = 0, B = 2.02, B = 3.98. (a) Estimate the probability of receiving the death penalty for the group most likely to receive it. [4 pts] (b) If, instead, parameters used constraints 3D = BY = 35 = 0, report the esti- mates. [3 pts] h (c) If, instead, parameters used constraints Σ₁ = Σ₁ BY = Σ; B = 0, report the estimates. [3 pts] Hint the probabilities, odds and odds ratios do not change with constraints.arrow_forwardSolve please and thank you!arrow_forwardSolve please and thank you!arrow_forward
- Question 1:We want to evaluate the impact on the monetary economy for a company of two types of strategy (competitive strategy, cooperative strategy) adopted by buyers.Competitive strategy: strategy characterized by firm behavior aimed at obtaining concessions from the buyer.Cooperative strategy: a strategy based on a problem-solving negotiating attitude, with a high level of trust and cooperation.A random sample of 17 buyers took part in a negotiation experiment in which 9 buyers adopted the competitive strategy, and the other 8 the cooperative strategy. The savings obtained for each group of buyers are presented in the pdf that i sent: For this problem, we assume that the samples are random and come from two normal populations of unknown but equal variances.According to the theory, the average saving of buyers adopting a competitive strategy will be lower than that of buyers adopting a cooperative strategy.a) Specify the population identifications and the hypotheses H0 and H1…arrow_forwardYou assume that the annual incomes for certain workers are normal with a mean of $28,500 and a standard deviation of $2,400. What’s the chance that a randomly selected employee makes more than $30,000?What’s the chance that 36 randomly selected employees make more than $30,000, on average?arrow_forwardWhat’s the chance that a fair coin comes up heads more than 60 times when you toss it 100 times?arrow_forward
- Suppose that you have a normal population of quiz scores with mean 40 and standard deviation 10. Select a random sample of 40. What’s the chance that the mean of the quiz scores won’t exceed 45?Select one individual from the population. What’s the chance that his/her quiz score won’t exceed 45?arrow_forwardSuppose that you take a sample of 100 from a population that contains 45 percent Democrats. What sample size condition do you need to check here (if any)?What’s the standard error of ^P?Compare the standard errors of ^p n=100 for ,n=1000 , n=10,000, and comment.arrow_forwardSuppose that a class’s test scores have a mean of 80 and standard deviation of 5. You choose 25 students from the class. What’s the chance that the group’s average test score is more than 82?arrow_forward
arrow_back_ios
SEE MORE QUESTIONS
arrow_forward_ios
Recommended textbooks for you
 Holt Mcdougal Larson Pre-algebra: Student Edition...AlgebraISBN:9780547587776Author:HOLT MCDOUGALPublisher:HOLT MCDOUGAL
Holt Mcdougal Larson Pre-algebra: Student Edition...
Algebra
ISBN:9780547587776
Author:HOLT MCDOUGAL
Publisher:HOLT MCDOUGAL
Continuous Probability Distributions - Basic Introduction; Author: The Organic Chemistry Tutor;https://www.youtube.com/watch?v=QxqxdQ_g2uw;License: Standard YouTube License, CC-BY
Probability Density Function (p.d.f.) Finding k (Part 1) | ExamSolutions; Author: ExamSolutions;https://www.youtube.com/watch?v=RsuS2ehsTDM;License: Standard YouTube License, CC-BY
Find the value of k so that the Function is a Probability Density Function; Author: The Math Sorcerer;https://www.youtube.com/watch?v=QqoCZWrVnbA;License: Standard Youtube License