
Concept explainers
Videos
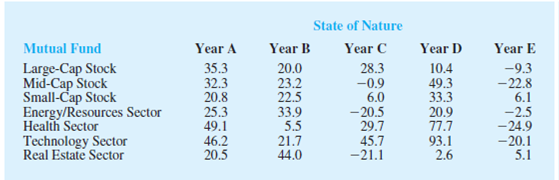
An investor wants to select one of seven mutual funds for the coming year. Data showing the percentage annual return for each fund during five typical one-year periods are shown here. The assumption is that one of these five-year periods will occur again during the coming year. Thus, years A, B, C, D, and E are the states of nature for the mutual fund decision.
- a. Suppose that an experienced financial analyst reviews the five states of nature and provides the following probabilities: .1, .3, .1, .1, and .4. Using the
expected value approach, what is the recommended mutual fund? What is the expected annual return? Using this mutual fund, what are the minimum and maximum annual returns? - b. A conservative investor notes that the Small-Cap mutual fund is the only fund that does not have the possibility of a loss. In fact, if the Small-Cap fund is chosen, the investor is guranteed a return of at least 6%. What is the expected annual return for this fund?
- c. Considering the mutual funds recommended in parts (a) and (b), which fund appears to have more risk? Why? Is the expected annual return greater for the mutual fund with more risk?
- d. What mutual fund would you recommend to the investor? Explain.
a.
Identify the recommended mutual fund. And compute the expected annual return.
Compute the minimum and maximum annual return Based on the recommended mutual fund.
Answer to Problem 18SE
The technology sector is the recommended mutual fund with expected annual return is 16.97%.
The minimum annual return for the technology sector is –20.1% and maximum annual return for the technology sector is 93.1%.
Explanation of Solution
Calculation:
There are a total of seven mutual funds. The table provides percentage annual return for each fund during five typical one-year periods. There are 5 states of nature for the mutual funds. The probabilities for states of nature are 0.1, 0.3, 0.1, 0.1, and 0.4 respectively.
Expected value approach:
The expected value (EV) of a decision rule
Where,
Since the problem deals with profit, the optimal decision is one with maximum expected value (EV).
The expected value for the Large-Cap Stock mutual fund is as follows:
Substitute the following values in the expected value approach,
Therefore,
The expected value Large-Cap Stock mutual fund is 9.68%.
Similarly the other expected values are obtained as shown in the table:
| Mutual Fund | Expected Annual Return |
| Large-Cap Stock | 9.68 |
| Mid-Cap Stock | |
| Small-Cap Stock | |
| Emergency/Resource Sector | |
| Health Sector | |
| Technology Sector | |
| Real Estate Sector |
From the expected values, it is clear that the technology sector provide maximum expected value. The annual return of technology sector is 16.97%.
From the table of percentage annual return, the minimum annual return for the technology sector is –20.1% and maximum annual return for the technology sector is 93.1%.
b.
Compute the expected annual return for Small-Cap Stock.
Answer to Problem 18SE
The expected annual return for Small-Cap Stock is 15.20%.
Explanation of Solution
The investor note that the Small-Cap mutual funds are mutual funds that does not have a chance of loss. The Small-Cap mutual funds guaranteed a return of at least 6%.
From part (a), it is clear that expected annual return for Small-Cap Stock is 15.20%. But the recommended mutual fund is technology sector with expected value 16.97%. The difference between recommended and Small-Cap Stock is 1.77%
Therefore, the expected annual return for Small-Cap Stock is 15.20%.
c.
Identify the mutual fund that explained in parts (a) and (b) is more risky. Explain the reason.
Check whether annual return greater for the mutual fund with more risk.
Answer to Problem 18SE
The technology sector is more risky. Annual return greater for the mutual fund with more risk.
Explanation of Solution
From the table of percentage annual return, the minimum annual return for the technology sector is –20.1% and maximum annual return for the technology sector is 93.1%. That is, the annual return for technology sector varies from –20.1% to 93.1%. The minimum annual return for the Small-Cap Stock is 6% and maximum annual return for the Small-Cap Stock is 33.3%. That is, the annual return for Small-Cap Stock varies from 6% to 33.3%. That is, the range of variation is high for technology sector. Therefore, technology sector is more risky. The technology sector also have a higher expected annual return but only by 1.77%. Hence Annual return greater for the mutual fund with more risk.
d.
Identify which mutual fund is recommended to the investor. Explain the reason.
Answer to Problem 18SE
The recommended mutual fund is Small-Cap Stock.
Explanation of Solution
The answer will vary. One of the possible answer is given below:
From part (c), it is clear that, risk associated with Small-Cap Stock mutual fund is less compared to technology sector. From part (b), the high risk technology sector only has a 1.77% higher expected annual return. Therefore, mutual fund that recommended to the investor is Small-Cap Stock mutual fund.
Want to see more full solutions like this?
Chapter 21 Solutions
Statistics for Business & Economics, Revised (MindTap Course List)


- 9. The concentration function of a random variable X is defined as Qx(h) = sup P(x ≤ X ≤x+h), h>0. Show that, if X and Y are independent random variables, then Qx+y (h) min{Qx(h). Qr (h)).arrow_forward10. Prove that, if (t)=1+0(12) as asf->> O is a characteristic function, then p = 1.arrow_forward9. The concentration function of a random variable X is defined as Qx(h) sup P(x ≤x≤x+h), h>0. (b) Is it true that Qx(ah) =aQx (h)?arrow_forward
- 3. Let X1, X2,..., X, be independent, Exp(1)-distributed random variables, and set V₁₁ = max Xk and W₁ = X₁+x+x+ Isk≤narrow_forward7. Consider the function (t)=(1+|t|)e, ER. (a) Prove that is a characteristic function. (b) Prove that the corresponding distribution is absolutely continuous. (c) Prove, departing from itself, that the distribution has finite mean and variance. (d) Prove, without computation, that the mean equals 0. (e) Compute the density.arrow_forward1. Show, by using characteristic, or moment generating functions, that if fx(x) = ½ex, -∞0 < x < ∞, then XY₁ - Y2, where Y₁ and Y2 are independent, exponentially distributed random variables.arrow_forward
- 1. Show, by using characteristic, or moment generating functions, that if 1 fx(x): x) = ½exarrow_forward1990) 02-02 50% mesob berceus +7 What's the probability of getting more than 1 head on 10 flips of a fair coin?arrow_forward9. The concentration function of a random variable X is defined as Qx(h) sup P(x≤x≤x+h), h>0. = x (a) Show that Qx+b(h) = Qx(h).arrow_forward
- Suppose that you buy a lottery ticket, and you have to pick six numbers from 1 through 50 (repetitions allowed). Which combination is more likely to win: 13, 48, 17, 22, 6, 39 or 1, 2, 3, 4, 5, 6? barrow_forward2 Make a histogram from this data set of test scores: 72, 79, 81, 80, 63, 62, 89, 99, 50, 78, 87, 97, 55, 69, 97, 87, 88, 99, 76, 78, 65, 77, 88, 90, and 81. Would a pie chart be appropriate for this data? ganizing Quantitative Data: Charts and Graphs 45arrow_forward10 Meteorologists use computer models to predict when and where a hurricane will hit shore. Suppose they predict that hurricane Stat has a 20 percent chance of hitting the East Coast. a. On what info are the meteorologists basing this prediction? b. Why is this prediction harder to make than your chance of getting a head on your next coin toss? U anoiaarrow_forward
 MATLAB: An Introduction with ApplicationsStatisticsISBN:9781119256830Author:Amos GilatPublisher:John Wiley & Sons Inc
 Probability and Statistics for Engineering and th...StatisticsISBN:9781305251809Author:Jay L. DevorePublisher:Cengage Learning
 Statistics for The Behavioral Sciences (MindTap C...StatisticsISBN:9781305504912Author:Frederick J Gravetter, Larry B. WallnauPublisher:Cengage Learning
 Elementary Statistics: Picturing the World (7th E...StatisticsISBN:9780134683416Author:Ron Larson, Betsy FarberPublisher:PEARSON
 The Basic Practice of StatisticsStatisticsISBN:9781319042578Author:David S. Moore, William I. Notz, Michael A. FlignerPublisher:W. H. Freeman
 Introduction to the Practice of StatisticsStatisticsISBN:9781319013387Author:David S. Moore, George P. McCabe, Bruce A. CraigPublisher:W. H. Freeman