College Majors The bar graph in Fig. 6 gives the intended majors of a group of 100 randomly selected college freshmen. (The biology category includes the biological and life sciences.) Six more students intend to major in biology than intend to major in business. The number of students intending to major in fields other than business or biology is 4 more than twice the number of students majoring in business or biology. Let x , y , and z represent the three numbers shown in the figure. Use the methods of this section to determine the values of x , y , and z . Figure 6 Intended Majors
College Majors The bar graph in Fig. 6 gives the intended majors of a group of 100 randomly selected college freshmen. (The biology category includes the biological and life sciences.) Six more students intend to major in biology than intend to major in business. The number of students intending to major in fields other than business or biology is 4 more than twice the number of students majoring in business or biology. Let x , y , and z represent the three numbers shown in the figure. Use the methods of this section to determine the values of x , y , and z . Figure 6 Intended Majors
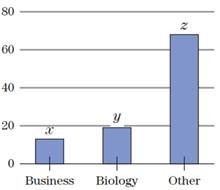
College Majors The bar graph in Fig. 6 gives the intended majors of a group of 100 randomly selected college freshmen. (The biology category includes the biological and life sciences.) Six more students intend to major in biology than intend to major in business. The number of students intending to major in fields other than business or biology is 4 more than twice the number of students majoring in business or biology. Let x, y, and z represent the three numbers shown in the figure. Use the methods of this section to determine the values of x, y, and z.
4.7 Use forward and backward difference approximations of O(h)
and a centered difference approximation of O(h²) to estimate the
first derivative of the function examined in Prob. 4.5. Evaluate the
derivative at x = 2 using a step size of h = 0.2. Compare your results
with the true value of the derivative. Interpret your results on the
basis of the remainder term of the Taylor series expansion.
• Plane II is spanned by the vectors:
P12
P2 = 1
• Subspace W is spanned by the vectors:
W₁ =
-- () ·
2
1
W2 =
0
but use the series for cosx
Chapter 2 Solutions
Finite Mathematics & Its Applications (12th Edition)
Intro Stats, Books a la Carte Edition (5th Edition)
Knowledge Booster
Learn more about
Need a deep-dive on the concept behind this application? Look no further. Learn more about this topic, subject and related others by exploring similar questions and additional content below.


 Glencoe Algebra 1, Student Edition, 9780079039897...AlgebraISBN:9780079039897Author:CarterPublisher:McGraw Hill
 Algebra: Structure And Method, Book 1AlgebraISBN:9780395977224Author:Richard G. Brown, Mary P. Dolciani, Robert H. Sorgenfrey, William L. ColePublisher:McDougal Littell
 Big Ideas Math A Bridge To Success Algebra 1: Stu...AlgebraISBN:9781680331141Author:HOUGHTON MIFFLIN HARCOURTPublisher:Houghton Mifflin Harcourt
 Holt Mcdougal Larson Pre-algebra: Student Edition...AlgebraISBN:9780547587776Author:HOLT MCDOUGALPublisher:HOLT MCDOUGAL
 College Algebra (MindTap Course List)AlgebraISBN:9781305652231Author:R. David Gustafson, Jeff HughesPublisher:Cengage Learning