Videos
(a)
Interpretation: The
Concept introduction:
Ocean acidification: The increase in concentration of carbon-dioxide in the atmosphere leads to ocean acidification. The amount is increasing day by day and this increase will lead to higher concentrations of dissolved
The concentration of hydronium ion is a key factor for many biochemical reactions. So variation may affect the organisms in the oceans.
The relationship between ocean
(a)
Answer to Problem 48GQ
The
Explanation of Solution
If the concentration of dissolved
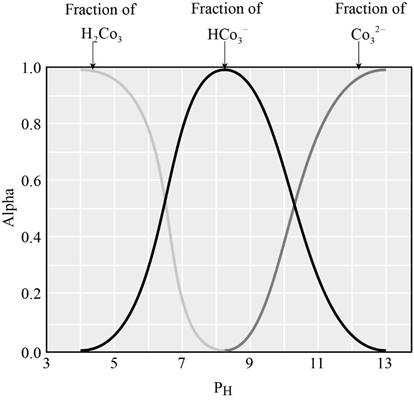
The graph showing the fraction of species in the solution as a function of

From the graph we can identify the
The fraction of dissociation will be 0.50 when the concentration of both the species will be equal.
The
(b)
Interpretation: The
Concept introduction:
Ocean acidification: The increase in concentration of carbon-dioxide in the atmosphere leads to ocean acidification. The amount is increasing day by day and this increase will lead to higher concentrations of dissolved
The concentration of hydronium ion is a key factor for many biochemical reactions. So variation may affect the organisms in the oceans.
The relationship between ocean
(b)
Answer to Problem 48GQ
The
Explanation of Solution
If the concentration of dissolved
The graph showing the fraction of species in the solution as a function of
From the graph we can identify the
The fraction of dissociation will be 0.50 when the concentration of both the species will be equal.
The
(c)
Interpretation: The predominant species in the solution when the
Concept introduction:
Ocean acidification: The increase in concentration of carbon-dioxide in the atmosphere leads to ocean acidification. The amount is increasing day by day and this increase will lead to higher concentrations of dissolved
The concentration of hydronium ion is a key factor for many biochemical reactions. So variation may affect the organisms in the oceans.
The relationship between ocean
(c)
Answer to Problem 48GQ
The predominant species in the solution when the
Explanation of Solution
If the concentration of dissolved
The graph showing the fraction of species in the solution as a function of

When the
From the graph it is clear that, the predominant species when the
(d)
Interpretation: The predominant species in the solution when the
Concept introduction:
Ocean acidification: The increase in concentration of carbon-dioxide in the atmosphere leads to ocean acidification. The amount is increasing day by day and this increase will lead to higher concentrations of dissolved
The concentration of hydronium ion is a key factor for many biochemical reactions. So variation may affect the organisms in the oceans.
The relationship between ocean
(d)
Answer to Problem 48GQ
The predominant species in the solution when the
Explanation of Solution
If the concentration of dissolved
The graph showing the fraction of species in the solution as a function of
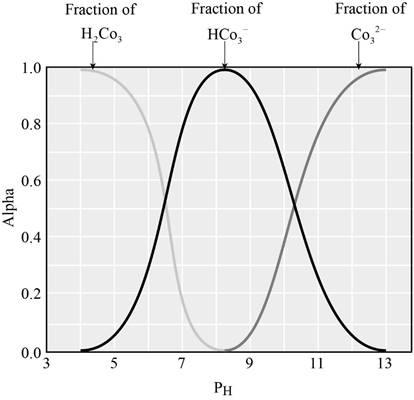
When the
From the graph it is clear that, the predominant species when the
Want to see more full solutions like this?
Chapter 20 Solutions
Chemistry & Chemical Reactivity


- Question: Find both the b (gradient) and a (y-intercept) value from the list of data below: (x1 -x̄) 370.5 (y1 - ȳ) 5.240 (x2 - x̄) 142.5 (y2 - ȳ) 2.004 (x3 - x̄) 28.5 (y3 - ȳ) 0.390 (x4 - x̄) -85.5 (y4 - ȳ) -1.231 (x5 - x̄) -199.5 (y5 - ȳ) -2.829 (x6 - x̄) -256.5 (y6 - ȳ) -3.575arrow_forwardCalculating standard reaction free energy from standard reduction... Using standard reduction potentials from the ALEKS Data tab, calculate the standard reaction free energy AG° for the following redox reaction. Be sure your answer has the correct number of significant digits. 3Cu+ (aq) + Cro²¯ (aq) +4H₂O (1) → 3Cu²+ (aq) +Cr(OH)3 (s)+5OH˜¯ (aq) 0 kJ ☐ x10 00. 18 Ararrow_forwardCalculating the pH of a weak base titrated with a strong acid An analytical chemist is titrating 241.7 mL of a 0.4900M solution of methylamine (CH3NH2) with a 0.7800M solution of HNO3. The pK of methylamine is 3.36. Calculate the pH of the base solution after the chemist has added 17.7 mL of the HNO3 solution to it. Note for advanced students: you may assume the final volume equals the initial volume of the solution plus the volume of HNO3 solution added. Round your answer to 2 decimal places. pH = ☑ ? 18 Ararrow_forward
- The following is two groups (Regular tomato sauce & Salt Reduced Tomato Sauce) of data recorded by a team analysising salt content in tomato sauce using the MOHR titration method: Regular Tomato Sauce Salt Reduced Tomato Sauce 223.4 148.7 353.7 278.2 334.6 268.7 305.6 234.4 340.0 262.7 304.3 283.2 244.7 143.6 QUESTION: For both groups of data calculate the answers attached in the image.arrow_forwardThe following is a two groups (Regular tomato sauce & Salt Reduced Tomato Sauce) of data recorded by a team analysising salt content in tomato sauce using the MOHR titration method: Regular Tomato Sauce Salt Reduced Tomato Sauce 340.0mmol/L 262.7mmol/L QUESTION: For both groups (Regular & Salt Reduced tomato sauce) of data provide answers to the following calculations below: 1. Standard Deviation (Sx) 2. T Values (t0.05,4) 3. 95% Confidence Interval (mmol/L) 4. [Na+] (mg/100 mL) 5. 95% Confidence Interval (mg/100 mL)arrow_forwardIf we have leucine (2-amino-4-methylpentanoic acid), alanine (2-aminopropanoic acid) and phenylalanine (2-amino-3-phenylpropanoic acid), indicate the tripeptides that can be formed (use the abbreviated symbols Leu., Ala and Phe).arrow_forward
- Briefly state why trifluoroacetic acid is more acidic than acetic acid.arrow_forwardExplain why acid chlorides are more reactive than amides in reactions with nucleophiles.arrow_forwardCalculating the pH of a weak base titrated with a strong acid An analytical chemist is titrating 101.7 mL of a 0.3500M solution of piperidine (C5H10NH) with a 0.05700M solution of HClO4. The pK of piperidine is 2.89. Calculate the pH of the base solution after the chemist has added 682.9 mL of the HClO solution to it. 4 Note for advanced students: you may assume the final volume equals the initial volume of the solution plus the volume of HClO solution added. 4 Round your answer to 2 decimal places. pH = .11 00. 18 Ararrow_forward
- The following is a two groups (Regular tomato sauce & Salt Reduced Tomato Sauce) of data recorded by a team analysising salt content in tomato sauce using the MOHR titration method: Regular Tomato Sauce Salt Reduced Tomato Sauce 340.0 262.7 QUESTION: For both groups of data provide answers to the calculations attached in the imagearrow_forward7. Concentration and uncertainty in the estimate of concentration (class data) Class mean for sample (Regular) |[Cl-] (mmol/L) class mean Sn za/2 95% Confidence Interval (mmol/L) [Na+] (mg/100 mL) 95% Confidence Interval (mg/100 mL)arrow_forwardThe following is a two groups (Regular tomato sauce & Salt Reduced Tomato Sauce) of data recorded by a team analysising salt content in tomato sauce using the MOHR titration method: Regular Tomato Sauce Salt Reduced Tomato Sauce 223.4 148.7 353.7 278.2 334.6 268.7 305.6 234.4 340.0 262.7 304.3 283.2 244.7 143.6 QUESTION: For both groups of data calculate the answers attached in the image.arrow_forward
 Chemistry & Chemical ReactivityChemistryISBN:9781337399074Author:John C. Kotz, Paul M. Treichel, John Townsend, David TreichelPublisher:Cengage Learning
 Chemistry & Chemical ReactivityChemistryISBN:9781133949640Author:John C. Kotz, Paul M. Treichel, John Townsend, David TreichelPublisher:Cengage Learning
 Chemistry: Principles and ReactionsChemistryISBN:9781305079373Author:William L. Masterton, Cecile N. HurleyPublisher:Cengage Learning
 Chemistry: The Molecular ScienceChemistryISBN:9781285199047Author:John W. Moore, Conrad L. StanitskiPublisher:Cengage Learning
 General Chemistry - Standalone book (MindTap Cour...ChemistryISBN:9781305580343Author:Steven D. Gammon, Ebbing, Darrell Ebbing, Steven D., Darrell; Gammon, Darrell Ebbing; Steven D. Gammon, Darrell D.; Gammon, Ebbing; Steven D. Gammon; DarrellPublisher:Cengage Learning