Videos
To review:
The change in the appearance of the zones of inhibition of the different antimicrobials if the medication concentrations in the strips were slightly decreased.
Introduction:
MIC is defined as the minimum inhibitory concentration. E-test is a process by which MIC can be determined for an antimicrobial agent. It is determined by reading the number where the growth of the microorganisms intersects the strips. A teardrop-shaped zone of inhibition is noted due to the gradient of concentration of the antimicrobials. A slight decrease in the concentration of antimicrobials will produce a narrower teardrop shaped zone of inhibition as compared to the one given in Figure 20.12.
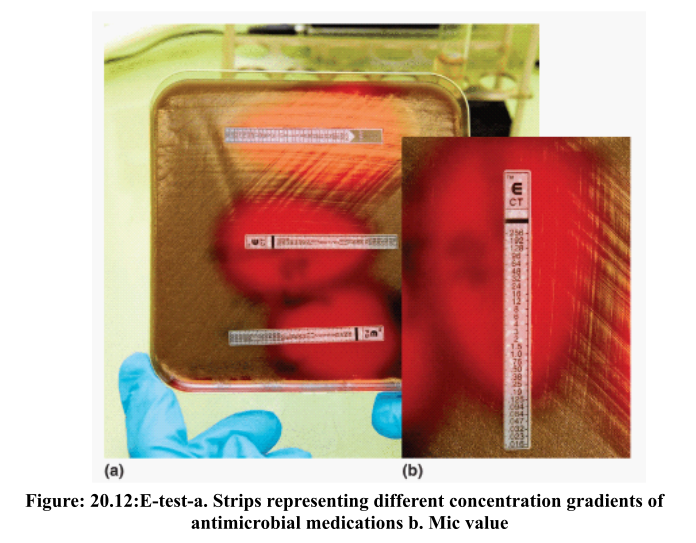
In Figure 20.12, the image of an E-test is given showing the MIC determination. It shows the multiple strips containing a gradient of concentrations of antimicrobials. The MIC is shown by reading the number where the growth intersects the strip.
Want to see the full answer?
Check out a sample textbook solution
Chapter 20 Solutions
Nester's Microbiology: A Human Perspective


- Amino Acid Coclow TABle 3' Gly Phe Leu (G) (F) (L) 3- Val (V) Arg (R) Ser (S) Ala (A) Lys (K) CAG G Glu Asp (E) (D) Ser (S) CCCAGUCAGUCAGUCAG 0204 C U A G C Asn (N) G 4 A AGU C GU (5) AC C UGA A G5 C CUGACUGACUGACUGAC Thr (T) Met (M) lle £€ (1) U 4 G Tyr Σε (Y) U Cys (C) C A G Trp (W) 3' U C A Leu בוט His Pro (P) ££ (H) Gin (Q) Arg 흐름 (R) (L) Start Stop 8. Transcription and Translation Practice: (Video 10-1 and 10-2) A. Below is the sense strand of a DNA gene. Using the sense strand, create the antisense DNA strand and label the 5' and 3' ends. B. Use the antisense strand that you create in part A as a template to create the mRNA transcript of the gene and label the 5' and 3' ends. C. Translate the mRNA you produced in part B into the polypeptide sequence making sure to follow all the rules of translation. 5'-AGCATGACTAATAGTTGTTGAGCTGTC-3' (sense strand) 4arrow_forwardWhat is the structure and function of Eukaryotic cells, including their organelles? How are Eukaryotic cells different than Prokaryotic cells, in terms of evolution which form of the cell might have came first? How do Eukaryotic cells become malignant (cancerous)?arrow_forwardWhat are the roles of DNA and proteins inside of the cell? What are the building blocks or molecular components of the DNA and proteins? How are proteins produced within the cell? What connection is there between DNA, proteins, and the cell cycle? What is the relationship between DNA, proteins, and Cancer?arrow_forward
- please fill in the empty sports, thank you!arrow_forwardIn one paragraph show how atoms and they're structure are related to the structure of dna and proteins. Talk about what atoms are. what they're made of, why chemical bonding is important to DNA?arrow_forwardWhat are the structure and properties of atoms and chemical bonds (especially how they relate to DNA and proteins).arrow_forward
- The Sentinel Cell: Nature’s Answer to Cancer?arrow_forwardMolecular Biology Question You are working to characterize a novel protein in mice. Analysis shows that high levels of the primary transcript that codes for this protein are found in tissue from the brain, muscle, liver, and pancreas. However, an antibody that recognizes the C-terminal portion of the protein indicates that the protein is present in brain, muscle, and liver, but not in the pancreas. What is the most likely explanation for this result?arrow_forwardMolecular Biology Explain/discuss how “slow stop” and “quick/fast stop” mutants wereused to identify different protein involved in DNA replication in E. coli.arrow_forward

 Principles Of Radiographic Imaging: An Art And A ...Health & NutritionISBN:9781337711067Author:Richard R. Carlton, Arlene M. Adler, Vesna BalacPublisher:Cengage Learning
- Essentials of Pharmacology for Health ProfessionsNursingISBN:9781305441620Author:WOODROWPublisher:Cengage