
a.
To draw: A payoff and profit diagram to depict a straddle position when the exercise price is $130.
Introduction:
Straddle Strategy: It is one of the strategies used in manipulating the call and put options. In this strategy, the investor faces a position where the call option and the put option are placed in the same position with the same strike price (X) and time (t). In other words, a straddle is supposed to be the combined value of both the call option and the put option.
a.
Answer to Problem 16PS
We can conclude that an increase in price increased profit also.
Explanation of Solution
The information given to us is as follows:
| Statement showing the prices of the options in straddles and spreads | ||||||||
| Straddles and Spreads | ||||||||
| Stock prices | ||||||||
| Market Price | 116.5 | |||||||
| Market price | 130 | X110 Straddle | X120 Straddle | |||||
| Ending Stock price | Profit | Ending Stock price | Profit | |||||
| Buying options: | -15.4 | -24 | ||||||
| Strike | Price | Payoff | Profit | Return% | 50 | 24.6 | 50 | 36 |
| 110 | 22.8 | 20 | -2.8 | -12.28% | 60 | 14.6 | 60 | 26 |
| 120 | 16.8 | 10 | -6.8 | -40.48% | 70 | 4.6 | 70 | 16 |
| 130 | 13.6 | 0 | -13.6 | -100.00% | 80 | -5.4 | 80 | 6 |
| 140 | 10.3 | 0 | -10.3 | -100.00% | 90 | -15.4 | 90 | -4 |
| 100 | -25.4 | 100 | -14 | |||||
| Strike | Price | Payoff | Profit | Return% | 110 | -35.4 | 110 | -24 |
| 110 | 12.6 | 0 | -12.6 | -100% | 120 | -25.4 | 120 | -34 |
| 120 | 17.2 | 0 | -17.2 | -100% | 130 | -15.4 | 130 | -24 |
| 130 | 23.6 | 0 | -23.6 | -100% | 140 | -5.4 | 140 | -14 |
| 140 | 30.5 | 10 | -20.5 | -67.21% | 150 | 4.6 | 150 | -4 |
| 160 | 14.6 | 160 | 6 | |||||
| Straddle | Price | Payoff | Profit | Return% | 170 | 24.6 | 170 | 16 |
| 110 | 35.4 | 20 | -15.4 | -43.50% | 180 | 34.6 | 180 | 26 |
| 120 | 34 | 10 | -24 | -70.59% | 190 | 44.6 | 190 | 36 |
| 130 | 37.2 | 0 | -37.2 | -100% | 200 | 54.6 | 200 | 46 |
| 140 | 40.8 | 10 | -30.8 | -75.49% | 210 | 64.6 | 210 | 56 |
| Selling options: | ||||||||
| Call options | Price | Payoff | Profit | Return% | Ending | Bullish Spread | ||
| Stock price | 7.5 | |||||||
| 110 | 22.8 | -20 | 2.8 | 12.28% | 50 | -12.5 | ||
| 120 | 16.8 | -10 | 6.8 | 40.48% | 60 | -12.5 | ||
| 130 | 13.6 | 0 | 13.6 | 100.00% | 70 | -12.5 | ||
| 140 | 10.3 | 0 | 10.3 | 100.00% | 80 | -12.5 | ||
| 90 | -12.5 | |||||||
| Put options | Price | Payoff | Profit | Return% | 100 | -12.5 | ||
| 110 | 16.6 | 0 | 12.6 | 100.00% | 110 | -12.5 | ||
| 120 | 17.2 | 0 | 17.2 | 100.00% | 120 | -2.5 | ||
| 130 | 23.6 | 0 | 23.6 | 100.00% | 130 | 7.5 | ||
| 140 | 30.5 | 10 | 40.5 | 132.79% | 140 | 17.5 | ||
| 150 | 17.5 | |||||||
| Money spread | Price | Payoff | Profit | 160 | 17.5 | |||
| Bullish spread | 170 | 17.5 | ||||||
| Purchase of Call option at 110 | 22.8 | 20 | -2.8 | 180 | 17.5 | |||
| Selling of Call option at 140 | 10.3 | 0 | 10.3 | 190 | 17.5 | |||
| Combined profit | 20 | 7.5 | 200 | 17.5 | ||||
| 210 | 17.5 | |||||||
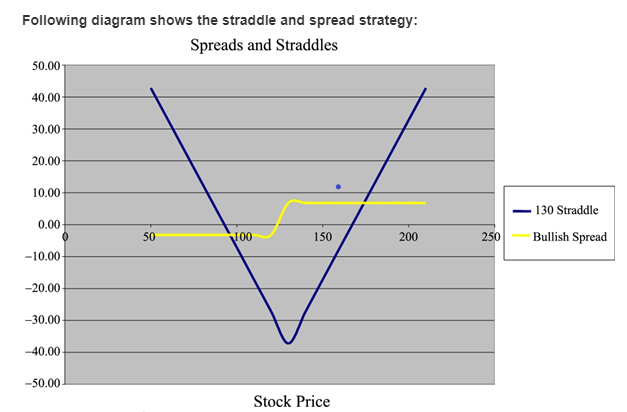
Let us use the same diagram for both the answers. Let us now understand the depiction of payoff and profit using a straddle strategy.
Like said before, in straddle strategy, both the call position and put position will be placed at the same place with the same strike price and expiration time. Let us observe the diagram. The blue shows the payoff and profit using a straddle strategy.
This diagram clears shows that when the price option of $110, the payoff is $20 and the net profit earned is $34.60. In a case where the price is $120, the profit earned is $44.60 and when the price rises to $130 the profit earned also rises to $54.60. Therefore, it means an increase in price increased profit also.
b.
To draw: A payoff and profit diagram to depict a bullish spread position when the exercise price is $120 and $130 assuming the excel position.
Introduction:
Bullish spread position: It is supposed to be a very optimistic option strategy. It is designed in such a way that profit can be earned even if there is a moderate increase in the price of the underlying asset.
b.
Answer to Problem 16PS
We can conclude that irrespective of a decline in market conditions, a net profit of $7.50 is earned.
Explanation of Solution
The information given to us is as follows:
| Statement showing the prices of the options in straddles and spreads | ||||||||
| Straddles and Spreads | ||||||||
| Stock prices | ||||||||
| Market Price | 116.5 | |||||||
| Market price | 130 | X110 Straddle | X120 Straddle | |||||
| Ending Stock price | Profit | Ending Stock price | Profit | |||||
| Buying options: | -15.4 | -24 | ||||||
| Strike | Price | Payoff | Profit | Return% | 50 | 24.6 | 50 | 36 |
| 110 | 22.8 | 20 | -2.8 | -12.28% | 60 | 14.6 | 60 | 26 |
| 120 | 16.8 | 10 | -6.8 | -40.48% | 70 | 4.6 | 70 | 16 |
| 130 | 13.6 | 0 | -13.6 | -100.00% | 80 | -5.4 | 80 | 6 |
| 140 | 10.3 | 0 | -10.3 | -100.00% | 90 | -15.4 | 90 | -4 |
| 100 | -25.4 | 100 | -14 | |||||
| Strike | Price | Payoff | Profit | Return% | 110 | -35.4 | 110 | -24 |
| 110 | 12.6 | 0 | -12.6 | -100% | 120 | -25.4 | 120 | -34 |
| 120 | 17.2 | 0 | -17.2 | -100% | 130 | -15.4 | 130 | -24 |
| 130 | 23.6 | 0 | -23.6 | -100% | 140 | -5.4 | 140 | -14 |
| 140 | 30.5 | 10 | -20.5 | -67.21% | 150 | 4.6 | 150 | -4 |
| 160 | 14.6 | 160 | 6 | |||||
| Straddle | Price | Payoff | Profit | Return% | 170 | 24.6 | 170 | 16 |
| 110 | 35.4 | 20 | -15.4 | -43.50% | 180 | 34.6 | 180 | 26 |
| 120 | 34 | 10 | -24 | -70.59% | 190 | 44.6 | 190 | 36 |
| 130 | 37.2 | 0 | -37.2 | -100% | 200 | 54.6 | 200 | 46 |
| 140 | 40.8 | 10 | -30.8 | -75.49% | 210 | 64.6 | 210 | 56 |
| Selling options: | ||||||||
| Call options | Price | Payoff | Profit | Return% | Ending | Bullish Spread | ||
| Stock price | 7.5 | |||||||
| 110 | 22.8 | -20 | 2.8 | 12.28% | 50 | -12.5 | ||
| 120 | 16.8 | -10 | 6.8 | 40.48% | 60 | -12.5 | ||
| 130 | 13.6 | 0 | 13.6 | 100.00% | 70 | -12.5 | ||
| 140 | 10.3 | 0 | 10.3 | 100.00% | 80 | -12.5 | ||
| 90 | -12.5 | |||||||
| Put options | Price | Payoff | Profit | Return% | 100 | -12.5 | ||
| 110 | 16.6 | 0 | 12.6 | 100.00% | 110 | -12.5 | ||
| 120 | 17.2 | 0 | 17.2 | 100.00% | 120 | -2.5 | ||
| 130 | 23.6 | 0 | 23.6 | 100.00% | 130 | 7.5 | ||
| 140 | 30.5 | 10 | 40.5 | 132.79% | 140 | 17.5 | ||
| 150 | 17.5 | |||||||
| Money spread | Price | Payoff | Profit | 160 | 17.5 | |||
| Bullish spread | 170 | 17.5 | ||||||
| Purchase of Call option at 110 | 22.8 | 20 | -2.8 | 180 | 17.5 | |||
| Selling of Call option at 140 | 10.3 | 0 | 10.3 | 190 | 17.5 | |||
| Combined profit | 20 | 7.5 | 200 | 17.5 | ||||
| 210 | 17.5 | |||||||

Let us use the same diagram for here also. Let us now understand the depiction of payoff and profit using a bullish spread strategy. The yellow line shown in the diagram depicts payoff and profit using a bullish spread strategy. When the diagram is observed, we find that when a call option is purchased at $110, the market is decreasing. When a call option is sold at $140, the net profit earned is $7.50. So, irrespective of a decline in market conditions, a net profit of $7.50 is earned.
Want to see more full solutions like this?
Chapter 20 Solutions
EBK INVESTMENTS

- Meticulous Drill & Reamer (MD&R) specializes in drilling and boring precise holes in hard metals (e.g., steel alloys, tungsten carbide, and titanium). The company recently contracted to drill holes with 3-centimeter diameters in large carbon-steel alloy disks, and it will have to purchase a special drill to complete this job. MD&R has eliminated all but two of the drills it has been considering: Davis Drills' T2005 and Worth Industrial Tools' AZ100. These producers have each agreed to allow MD&R to use a T2005 and an AZ100 for one week to determine which drill it will purchase. During the one-week trial, MD&R uses each of these drills to drill 31 holes with a target diameter of 3 centimeters in one large carbon-steel alloy disk, then measures the diameter of each hole and records the results. MD&R's results are provided in the table that follows and are available in the DATAfile named MeticulousDrills, Hole Diameter T2005 AZ100 3.06 2.91 3.04 3.31 3.13 2.82 3.01 3.01 2.95 2.94 3.02…arrow_forwardI mistakenly submitted blurr image please comment i will write values. please dont Solve with incorrect values otherwise unhelpful.arrow_forwardhello tutor:If submitted image is blurr then please comment i will write values. i will give unhelpful please.arrow_forward
- Lara Fredericks is interested in two mutually exclusive investments. Both investments cover the same time horizon of 5 years. The cost of the first investment is $9900, and Lara expects equal and consecutive year-end payments of $3400. The second investment promises equal and consecutive payments of $4100 with an initial outlay of $12500 required. The current required return on the first investment is 8.4 %, and the second carries a required return of 10.4 %.a. What is the net present value of the first investment?b. What is the net present value of the second investment?c. Being mutually exclusive, which investment should Lara choose? d. Which investment is relatively more risky? Explain.arrow_forwardWhat are some of the characteristics of a firm with a long operating cycle?arrow_forwardAbout this Assignment For this Corporate Finance 301 assignment, you will submit a research paper that analyzes the types of organizational business structures. You will apply knowledge of business structure concepts as acquired in the course. The research paper should follow APA formatting style. Project Prompts The written research paper should be at least 1,000 to 1,200 words in length and should include four sections based on the business structures studied throughout the course. Define each business structure, compare the corporate finance strategies of the four business structures, discuss the advantages and disadvantages of each business structure, and how each varies in taxation. Research Paper Sections ⚫ Sole Proprietorship ⚫ Partnership • Corporation ⚫ Limited Liability Company (LLC)arrow_forward
- PLEASE ANSWER THE COLUMN FULLY AND CORRECTLY PLEASE DO THE RIGHT CALCULATION DOUBLE CHECK AS WELL TO GIVE ME THE RIGHT ANSWER REQUIRED: Given the following information, what are the NZD/SGD currency against currency bid-ask quotations? Note: Do not round intermediate calculations. Round your answers to 4 decimal places. Bank Quotations American Terms European Terms Bid Ask Bid Ask New Zealand dollar 0.733 0.7340 1.3870 1.3884 Singapore dollar 0.6186 0.6191 1.6423 1.6436 answer Bid Ask New Zealand dollar ? ? Singapore dollar ? ?arrow_forwardAbout this Assignment For the Corporate Finance 301 assignment, you will submit a research paper that analyzes and discusses organizational financial risks. You will apply knowledge acquired in the course and use the concepts of multiple financial risks as the basis of research and analysis. The research paper should follow APA formatting style. Audience: upper-level business students. Project Prompt Write a 1,000-1,200-word analysis discussing financial risk concepts and assess the impact of the different financial risks on an organization. For this assignment, you will structure your assignment using four research paper sections associated with corporate risk management, as studied in the course. Base your research paper on the financial statements analyzed in Corporate Finance 301 assignment 2 and apply the knowledge acquired in the analysis. Define each financial risk, discuss the risk associated components, and evaluate the financial risks and how they affect the corporation's…arrow_forwardBobby Nelson, made deposits of $880 at the end of each year for 6 years. Interest is 6% compounded annually. What is the value of Bobby’s annuity at the end of 6 years?arrow_forward
- 1. Find the future value if $1,250 is invested in Simple interest account paying 6.5%: a. for 5 years b. for 20 years 2. Find the future amount $ 35,000 is invested for 30 years at 4.25% compounded: a. annually b. Quarterly c. monthly d. weekly 3. How much should be put into an account today that pays 7.75% compounded monthly if you need $10,000 in 5 years. 4. Find the effective rate for: a. 5.75% compounded quarterly b. 6.25% compounded daily. 5. $50 is invested at the end of each month into an account paying 7.5% compounded monthly. How much will be in the account after 5 years?…arrow_forwardSolve step by step no aiarrow_forwardDont use ai solve itarrow_forward
 Essentials Of Business AnalyticsStatisticsISBN:9781285187273Author:Camm, Jeff.Publisher:Cengage Learning,
 Principles of Cost AccountingAccountingISBN:9781305087408Author:Edward J. Vanderbeck, Maria R. MitchellPublisher:Cengage Learning
 Essentials of Business Analytics (MindTap Course ...StatisticsISBN:9781305627734Author:Jeffrey D. Camm, James J. Cochran, Michael J. Fry, Jeffrey W. Ohlmann, David R. AndersonPublisher:Cengage Learning
 Excel Applications for Accounting PrinciplesAccountingISBN:9781111581565Author:Gaylord N. SmithPublisher:Cengage Learning
 Financial Reporting, Financial Statement Analysis...FinanceISBN:9781285190907Author:James M. Wahlen, Stephen P. Baginski, Mark BradshawPublisher:Cengage Learning