
Videos
a.
Obtain a frequency distribution for the variable Team salary.
Find the typical salary for a team.
Find the
a.
Answer to Problem 52DA
The frequency distribution for the salary is given below:
| Salary $1,000,000’s | Number of teams | Cumulative frequency |
| 60-100 | 10 | 10 |
| 100-140 | 12 | 22 |
| 140-180 | 6 | 28 |
| 180-220 | 1 | 29 |
| 220-260 | 1 | 30 |
| Total | 30 |
The typical salary of a team is from 100 to 400 million dollars.
The range of the salaries is 200 million dollars.
Explanation of Solution
Selection of number of classes:
“2 to the k rule” suggests that the number of classes is the smallest value of k, where
It is given that the data set consists of 30 observations. The value of k can be obtained as follows:
Here,
Therefore, the number of classes for the given data set is 5.
From the data set Team salary, the maximum and minimum values are 230.4 and 65.8, respectively.
The formula for the class interval is given as follows:
Where, i is the class interval and k is the number of classes.
Therefore, the class interval for the given data can be obtained as follows:
In practice, the class interval size is usually rounded up to some convenient number. Therefore, the reasonable class interval is 40.
Frequency distribution:
The frequency table is a collection of mutually exclusive and exhaustive classes, which shows the number of observations in each class.
Since the minimum value is 65.8 and the class interval is 40, the first class would be 60–100. The frequency distribution for salary can be constructed as follows:
| Salary $1,000,000’s | Number of teams | Cumulative frequency |
| 60-100 | 10 | 10 |
| 100-140 | 12 | |
| 140-180 | 6 | |
| 180-220 | 1 | |
| 220-260 | 1 | |
| Total | 30 |
From the above frequency distribution, the typical salary of a team is from 100 to 400 million dollars.
The range of the salaries is from 60 to 260 million dollars. Thus, range of the salaries is 200 million dollars.
b.
Make a comment on shape of the distribution.
Check whether there are any teams that have a salary out of the line with the others.
b.
Answer to Problem 52DA
The distribution of salaries is positively skewed.
There are two teams with salaries much higher than the remaining 28 team salaries.
Explanation of Solution
From the frequency distribution in Part (a), 22 out of 30 teams fall in first and second classes. Therefore, the distribution of salaries is positively skewed.
There are two teams with salaries much higher than the remaining 28 team salaries. These two teams have a salary out of the line with the others.
c.
Create a cumulative relative frequency
Identify the amount that is less than for the 40% of the team’s salary.
Find the number of teams that have a total salary of more than $220 million.
c.
Answer to Problem 52DA
The cumulative frequency polygon for the given data is as follows:
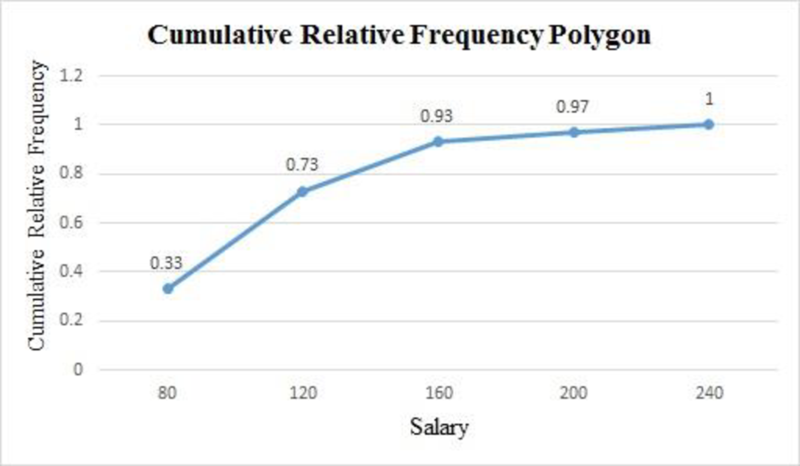
There are 40% of the teams that have salary less than 90 million dollars.
There is only one team that is getting salary more than 220 million dollars.
Explanation of Solution
For the given data set, the cumulative relative frequency table with midpoints of classes is obtained as follows:
| Salary$1,000,000’s | Midpoint | Cumulative frequency | Relative cumulative frequency |
| 60-100 | 10 | ||
| 100-140 | 22 | ||
| 140-180 | 28 | ||
| 180-220 | 29 | ||
| 220-260 | 30 |
The cumulative relative frequency polygon for the given data can be drawn using EXCEL.
Step-by-step procedure to obtain the frequency polygon using EXCEL is as follows:
- Enter the column of midpoints along with the cumulative relative frequency column.
- Select the total data range with labels.
- Go to Insert > Charts > line chart.
- Select the appropriate line chart.
- Click OK.
From the above cumulative relative frequency polygon, 40% of the teams have salary less than 90 million dollars.
There are 3% of the teams that get salary more than 220 million dollars. In the given data, 3% of teams are equal to 1 team. Thus, only one team is getting salary more than 220 million dollars.
Want to see more full solutions like this?
Chapter 2 Solutions
Loose Leaf for Statistical Techniques in Business and Economics


- For a binary asymmetric channel with Py|X(0|1) = 0.1 and Py|X(1|0) = 0.2; PX(0) = 0.4 isthe probability of a bit of “0” being transmitted. X is the transmitted digit, and Y is the received digit.a. Find the values of Py(0) and Py(1).b. What is the probability that only 0s will be received for a sequence of 10 digits transmitted?c. What is the probability that 8 1s and 2 0s will be received for the same sequence of 10 digits?d. What is the probability that at least 5 0s will be received for the same sequence of 10 digits?arrow_forwardV2 360 Step down + I₁ = I2 10KVA 120V 10KVA 1₂ = 360-120 or 2nd Ratio's V₂ m 120 Ratio= 360 √2 H I2 I, + I2 120arrow_forwardQ2. [20 points] An amplitude X of a Gaussian signal x(t) has a mean value of 2 and an RMS value of √(10), i.e. square root of 10. Determine the PDF of x(t).arrow_forward
- In a network with 12 links, one of the links has failed. The failed link is randomlylocated. An electrical engineer tests the links one by one until the failed link is found.a. What is the probability that the engineer will find the failed link in the first test?b. What is the probability that the engineer will find the failed link in five tests?Note: You should assume that for Part b, the five tests are done consecutively.arrow_forwardProblem 3. Pricing a multi-stock option the Margrabe formula The purpose of this problem is to price a swap option in a 2-stock model, similarly as what we did in the example in the lectures. We consider a two-dimensional Brownian motion given by W₁ = (W(¹), W(2)) on a probability space (Q, F,P). Two stock prices are modeled by the following equations: dX = dY₁ = X₁ (rdt+ rdt+0₁dW!) (²)), Y₁ (rdt+dW+0zdW!"), with Xo xo and Yo =yo. This corresponds to the multi-stock model studied in class, but with notation (X+, Y₁) instead of (S(1), S(2)). Given the model above, the measure P is already the risk-neutral measure (Both stocks have rate of return r). We write σ = 0₁+0%. We consider a swap option, which gives you the right, at time T, to exchange one share of X for one share of Y. That is, the option has payoff F=(Yr-XT). (a) We first assume that r = 0 (for questions (a)-(f)). Write an explicit expression for the process Xt. Reminder before proceeding to question (b): Girsanov's theorem…arrow_forwardProblem 1. Multi-stock model We consider a 2-stock model similar to the one studied in class. Namely, we consider = S(1) S(2) = S(¹) exp (σ1B(1) + (M1 - 0/1 ) S(²) exp (02B(2) + (H₂- M2 where (B(¹) ) +20 and (B(2) ) +≥o are two Brownian motions, with t≥0 Cov (B(¹), B(2)) = p min{t, s}. " The purpose of this problem is to prove that there indeed exists a 2-dimensional Brownian motion (W+)+20 (W(1), W(2))+20 such that = S(1) S(2) = = S(¹) exp (011W(¹) + (μ₁ - 01/1) t) 롱) S(²) exp (021W (1) + 022W(2) + (112 - 03/01/12) t). where σ11, 21, 22 are constants to be determined (as functions of σ1, σ2, p). Hint: The constants will follow the formulas developed in the lectures. (a) To show existence of (Ŵ+), first write the expression for both W. (¹) and W (2) functions of (B(1), B(²)). as (b) Using the formulas obtained in (a), show that the process (WA) is actually a 2- dimensional standard Brownian motion (i.e. show that each component is normal, with mean 0, variance t, and that their…arrow_forward
- The scores of 8 students on the midterm exam and final exam were as follows. Student Midterm Final Anderson 98 89 Bailey 88 74 Cruz 87 97 DeSana 85 79 Erickson 85 94 Francis 83 71 Gray 74 98 Harris 70 91 Find the value of the (Spearman's) rank correlation coefficient test statistic that would be used to test the claim of no correlation between midterm score and final exam score. Round your answer to 3 places after the decimal point, if necessary. Test statistic: rs =arrow_forwardBusiness discussarrow_forwardBusiness discussarrow_forward
 Big Ideas Math A Bridge To Success Algebra 1: Stu...AlgebraISBN:9781680331141Author:HOUGHTON MIFFLIN HARCOURTPublisher:Houghton Mifflin Harcourt
 Glencoe Algebra 1, Student Edition, 9780079039897...AlgebraISBN:9780079039897Author:CarterPublisher:McGraw Hill
 Holt Mcdougal Larson Pre-algebra: Student Edition...AlgebraISBN:9780547587776Author:HOLT MCDOUGALPublisher:HOLT MCDOUGAL