
Loose Leaf for Statistical Techniques in Business and Economics
17th Edition
ISBN: 9781260152647
Author: Douglas A. Lind
Publisher: McGraw-Hill Education
expand_more
expand_more
format_list_bulleted
Videos
Textbook Question
Chapter 2, Problem 42CE
A recent study of home technologies reported the number of hours of personal computer usage per week for a sample of 60 persons. Excluded from the study were people who worked out of their home and used the computer as a part of their work.
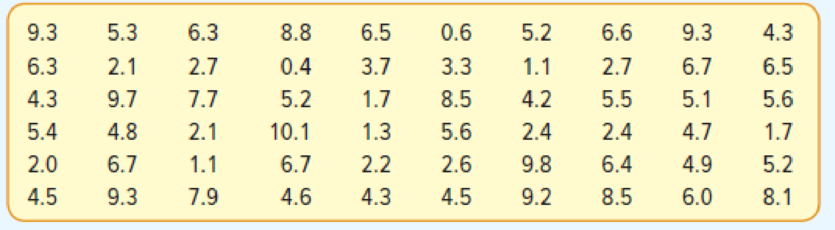
- a. Organize the data into a frequency distribution. How many classes would you suggest? What value would you suggest for a class interval?
- b. Draw a histogram. Describe your result.
Expert Solution & Answer
Want to see the full answer?
Check out a sample textbook solution
Students have asked these similar questions
3. (i) Consider the following R code:
wilcox.test(UK Supermarkets $Salary ~ UKSupermarkets $Supermarket)
(a) Which test is being used in this code?
(b) What is the name of the dataset under consideration?
How would be adapt this code if we had ties? What other command
can be used which deals with ties?
(ii) Consider the following R code:
install packages("nortest")
library(nortest)
lillie.test (Differences)
(a) Assuming the appropriate dataset has been imported and attached,
what is wrong with this code?
(b) If this code were to be corrected, what would be determined by run-
ning it?
[3 Marks]
1. (i) Explain the difference in application between the Mann-Whitney U test
and the Wilcoxon Signed-Rank test, i.e. in which scenarios would each test be
used?
(ii) What is the main procedure underlying these nonparametric tests?
[3 Marks]
You may need to use the appropriate appendix table or technology to answer this question.
You are given the following information obtained from a random sample of 4 observations.
24
48
31
57
You want to determine whether or not the mean of the population from which this sample was taken is significantly different from 49. (Assume the population is normally distributed.)
(a)
State the null and the alternative hypotheses. (Enter != for ≠ as needed.)
H0:
Ha:
(b)
Determine the test statistic. (Round your answer to three decimal places.)
(c)
Determine the p-value, and at the 5% level of significance, test to determine whether or not the mean of the population is significantly different from 49.
Find the p-value. (Round your answer to four decimal places.)
p-value =
State your conclusion.
Reject H0. There is insufficient evidence to conclude that the mean of the population is different from 49.Do not reject H0. There is sufficient evidence to conclude that the…
Chapter 2 Solutions
Loose Leaf for Statistical Techniques in Business and Economics
Ch. 2 - DeCenzo Specialty Food and Beverage Company has...Ch. 2 - A pie chart shows the relative market share of...Ch. 2 - In a marketing study, 100 consumers were asked to...Ch. 2 - A total of 1,000 residents in Minnesota were asked...Ch. 2 - Two thousand frequent business travelers are asked...Ch. 2 - Wellstone Inc. produces and markets replacement...Ch. 2 - A small business consultant is investigating the...Ch. 2 - In the first quarter of last year, the 11 members...Ch. 2 - Prob. 3SRCh. 2 - A set of data consists of 38 observations. How...
Ch. 2 - A set of data consists of 45 observations between...Ch. 2 - A set of data consists of 230 observations between...Ch. 2 - A set of data contains 53 observations. The...Ch. 2 - Wachesaw Manufacturing Inc. produced the following...Ch. 2 - The Quick Change Oil Company has a number of...Ch. 2 - The manager of the BiLo Supermarket in Mt....Ch. 2 - The food services division of Cedar River...Ch. 2 - The annual imports of a selected group of...Ch. 2 - Mollys Candle Shop has several retail stores in...Ch. 2 - The following chart shows the number of patients...Ch. 2 - The following frequency distribution reports the...Ch. 2 - Prob. 18ECh. 2 - A sample of the hourly wages of 15 employees at...Ch. 2 - The following cumulative frequency and the...Ch. 2 - The cumulative frequency and the cumulative...Ch. 2 - The frequency distribution representing the number...Ch. 2 - Prob. 22ECh. 2 - Describe the similarities and differences of...Ch. 2 - Describe the similarities and differences between...Ch. 2 - Alexandra Damonte will be building a new resort in...Ch. 2 - Prob. 26CECh. 2 - A data set consists of 83 observations. How many...Ch. 2 - A data set consists of 145 observations that range...Ch. 2 - The following is the number of minutes to commute...Ch. 2 - The following data give the weekly amounts spent...Ch. 2 - A social scientist is studying the use of iPods by...Ch. 2 - David Wise handles his own investment portfolio,...Ch. 2 - You are exploring the music in your iTunes...Ch. 2 - The monthly issues of the Journal of Finance are...Ch. 2 - The following histogram shows the scores on the...Ch. 2 - The following chart summarizes the selling price...Ch. 2 - A chain of sport shops catering to beginning...Ch. 2 - The numbers of outstanding shares for 24 publicly...Ch. 2 - A recent survey showed that the typical American...Ch. 2 - Midland National Bank selected a sample of 40...Ch. 2 - Residents of the state of South Carolina earned a...Ch. 2 - A recent study of home technologies reported the...Ch. 2 - Merrill Lynch recently completed a study regarding...Ch. 2 - A total of 5.9% of the prime-time viewing audience...Ch. 2 - Refer to the following chart: a. What is the name...Ch. 2 - The following chart depicts the annual revenues,...Ch. 2 - Prob. 47CECh. 2 - Prob. 48CECh. 2 - One of the most popular candies in the United...Ch. 2 - The number of families who used the Minneapolis...Ch. 2 - Refer to the North Valley Real Estate data that...Ch. 2 - Prob. 52DACh. 2 - Refer to the Lincolnville School District bus...
Knowledge Booster


Learn more about
Need a deep-dive on the concept behind this application? Look no further. Learn more about this topic, statistics and related others by exploring similar questions and additional content below.Similar questions
- 65% of all violent felons in the prison system are repeat offenders. If 43 violent felons are randomly selected, find the probability that a. Exactly 28 of them are repeat offenders. b. At most 28 of them are repeat offenders. c. At least 28 of them are repeat offenders. d. Between 22 and 26 (including 22 and 26) of them are repeat offenders.arrow_forward08:34 ◄ Classroom 07:59 Probs. 5-32/33 D ا. 89 5-34. Determine the horizontal and vertical components of reaction at the pin A and the normal force at the smooth peg B on the member. A 0,4 m 0.4 m Prob. 5-34 F=600 N fr th ar 0. 163586 5-37. The wooden plank resting between the buildings deflects slightly when it supports the 50-kg boy. This deflection causes a triangular distribution of load at its ends. having maximum intensities of w, and wg. Determine w and wg. each measured in N/m. when the boy is standing 3 m from one end as shown. Neglect the mass of the plank. 0.45 m 3 marrow_forwardExamine the Variables: Carefully review and note the names of all variables in the dataset. Examples of these variables include: Mileage (mpg) Number of Cylinders (cyl) Displacement (disp) Horsepower (hp) Research: Google to understand these variables. Statistical Analysis: Select mpg variable, and perform the following statistical tests. Once you are done with these tests using mpg variable, repeat the same with hp Mean Median First Quartile (Q1) Second Quartile (Q2) Third Quartile (Q3) Fourth Quartile (Q4) 10th Percentile 70th Percentile Skewness Kurtosis Document Your Results: In RStudio: Before running each statistical test, provide a heading in the format shown at the bottom. “# Mean of mileage – Your name’s command” In Microsoft Word: Once you've completed all tests, take a screenshot of your results in RStudio and paste it into a Microsoft Word document. Make sure that snapshots are very clear. You will need multiple snapshots. Also transfer these results to the…arrow_forward
- Examine the Variables: Carefully review and note the names of all variables in the dataset. Examples of these variables include: Mileage (mpg) Number of Cylinders (cyl) Displacement (disp) Horsepower (hp) Research: Google to understand these variables. Statistical Analysis: Select mpg variable, and perform the following statistical tests. Once you are done with these tests using mpg variable, repeat the same with hp Mean Median First Quartile (Q1) Second Quartile (Q2) Third Quartile (Q3) Fourth Quartile (Q4) 10th Percentile 70th Percentile Skewness Kurtosis Document Your Results: In RStudio: Before running each statistical test, provide a heading in the format shown at the bottom. “# Mean of mileage – Your name’s command” In Microsoft Word: Once you've completed all tests, take a screenshot of your results in RStudio and paste it into a Microsoft Word document. Make sure that snapshots are very clear. You will need multiple snapshots. Also transfer these results to the…arrow_forwardExamine the Variables: Carefully review and note the names of all variables in the dataset. Examples of these variables include: Mileage (mpg) Number of Cylinders (cyl) Displacement (disp) Horsepower (hp) Research: Google to understand these variables. Statistical Analysis: Select mpg variable, and perform the following statistical tests. Once you are done with these tests using mpg variable, repeat the same with hp Mean Median First Quartile (Q1) Second Quartile (Q2) Third Quartile (Q3) Fourth Quartile (Q4) 10th Percentile 70th Percentile Skewness Kurtosis Document Your Results: In RStudio: Before running each statistical test, provide a heading in the format shown at the bottom. “# Mean of mileage – Your name’s command” In Microsoft Word: Once you've completed all tests, take a screenshot of your results in RStudio and paste it into a Microsoft Word document. Make sure that snapshots are very clear. You will need multiple snapshots. Also transfer these results to the…arrow_forward2 (VaR and ES) Suppose X1 are independent. Prove that ~ Unif[-0.5, 0.5] and X2 VaRa (X1X2) < VaRa(X1) + VaRa (X2). ~ Unif[-0.5, 0.5]arrow_forward
- 8 (Correlation and Diversification) Assume we have two stocks, A and B, show that a particular combination of the two stocks produce a risk-free portfolio when the correlation between the return of A and B is -1.arrow_forward9 (Portfolio allocation) Suppose R₁ and R2 are returns of 2 assets and with expected return and variance respectively r₁ and 72 and variance-covariance σ2, 0%½ and σ12. Find −∞ ≤ w ≤ ∞ such that the portfolio wR₁ + (1 - w) R₂ has the smallest risk.arrow_forward7 (Multivariate random variable) Suppose X, €1, €2, €3 are IID N(0, 1) and Y2 Y₁ = 0.2 0.8X + €1, Y₂ = 0.3 +0.7X+ €2, Y3 = 0.2 + 0.9X + €3. = (In models like this, X is called the common factors of Y₁, Y₂, Y3.) Y = (Y1, Y2, Y3). (a) Find E(Y) and cov(Y). (b) What can you observe from cov(Y). Writearrow_forward
- 1 (VaR and ES) Suppose X ~ f(x) with 1+x, if 0> x > −1 f(x) = 1−x if 1 x > 0 Find VaRo.05 (X) and ES0.05 (X).arrow_forwardJoy is making Christmas gifts. She has 6 1/12 feet of yarn and will need 4 1/4 to complete our project. How much yarn will she have left over compute this solution in two different ways arrow_forwardSolve for X. Explain each step. 2^2x • 2^-4=8arrow_forward
arrow_back_ios
SEE MORE QUESTIONS
arrow_forward_ios
Recommended textbooks for you
 Holt Mcdougal Larson Pre-algebra: Student Edition...AlgebraISBN:9780547587776Author:HOLT MCDOUGALPublisher:HOLT MCDOUGAL
 Big Ideas Math A Bridge To Success Algebra 1: Stu...AlgebraISBN:9781680331141Author:HOUGHTON MIFFLIN HARCOURTPublisher:Houghton Mifflin Harcourt
 Glencoe Algebra 1, Student Edition, 9780079039897...AlgebraISBN:9780079039897Author:CarterPublisher:McGraw Hill
Holt Mcdougal Larson Pre-algebra: Student Edition...
Algebra
ISBN:9780547587776
Author:HOLT MCDOUGAL
Publisher:HOLT MCDOUGAL
Big Ideas Math A Bridge To Success Algebra 1: Stu...
Algebra
ISBN:9781680331141
Author:HOUGHTON MIFFLIN HARCOURT
Publisher:Houghton Mifflin Harcourt
Glencoe Algebra 1, Student Edition, 9780079039897...
Algebra
ISBN:9780079039897
Author:Carter
Publisher:McGraw Hill
How to make Frequency Distribution Table / Tally Marks and Frequency Distribution Table; Author: Reenu Math;https://www.youtube.com/watch?v=i_A6RiE8tLE;License: Standard YouTube License, CC-BY
Frequency distribution table in statistics; Author: Math and Science;https://www.youtube.com/watch?v=T7KYO76DoOE;License: Standard YouTube License, CC-BY
Frequency Distribution Table for Grouped/Continuous data | Math Dot Com; Author: Maths dotcom;https://www.youtube.com/watch?v=ErnccbXQOPY;License: Standard Youtube License