Pearson eText Business Statistics: First Course -- Instant Access (Pearson+)
8th Edition
ISBN: 9780136880974
Author: David Levine, David Stephan
Publisher: PEARSON+
expand_more
expand_more
format_list_bulleted
Concept explainers
Videos
Textbook Question
Chapter 2, Problem 2.91CRP
The owner of a restaurant that serves Continental-style entrées has the business objective of learning more about the patterns of patron demand during the Friday-to-Sunday weekend time period. Data were collected from 630 customers on the type of entrée ordered and were organized in the following table (and stored in ENMTREE):
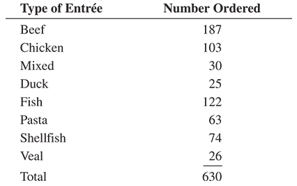
- Construct a percentage summary table for the types of entrées ordered.
- Construct a bar chart, a pie chart, doughnut chart, and a Pareto chart for the types of entrées ordered.
- Do you prefer using a Pareto Chart or a pie Chart for these data? Why?
- What conclusions can the restaurant owner reach concerning demand for different types of entrées?
Expert Solution & Answer
Want to see the full answer?
Check out a sample textbook solution
Students have asked these similar questions
1.2.17. (!) Let G,, be the graph whose vertices are the permutations of (1,..., n}, with
two permutations a₁, ..., a,, and b₁, ..., b, adjacent if they differ by interchanging a pair
of adjacent entries (G3 shown below). Prove that G,, is connected.
132
123
213
312
321
231
You are planning an experiment to determine the effect of the brand of gasoline and the weight of a car on gas mileage measured in miles per gallon. You will use a single test car, adding weights so that its total weight is 3000, 3500, or 4000 pounds. The car will drive on a test track at each weight using each of Amoco, Marathon, and Speedway gasoline. Which is the best way to organize the study?
Start with 3000 pounds and Amoco and run the car on the test track. Then do 3500 and 4000 pounds. Change to Marathon and go through the three weights in order. Then change to Speedway and do the three weights in order once more.
Start with 3000 pounds and Amoco and run the car on the test track. Then change to Marathon and then to Speedway without changing the weight. Then add weights to get 3500 pounds and go through the three gasolines in the same order.Then change to 4000 pounds and do the three gasolines in order again.
Choose a gasoline at random, and run the car with this gasoline at…
AP1.2 A child is 40 inches tall, which places her at the 90th percentile of all children of similar age. The heights for children of this age form an approximately Normal distribution with a mean of 38 inches. Based on this information, what is the standard deviation of the heights of all children of this age?
0.20 inches (c) 0.65 inches (e) 1.56 inches
0.31 inches (d) 1.21 inches
Chapter 2 Solutions
Pearson eText Business Statistics: First Course -- Instant Access (Pearson+)
Ch. 2 - Prob. 2.1LBCh. 2 - The following data represent the responses to two...Ch. 2 - Prob. 2.3ACCh. 2 - Prob. 2.5ACCh. 2 - Prob. 2.6ACCh. 2 - Prob. 2.7ACCh. 2 - Prob. 2.8ACCh. 2 - Prob. 2.10ACCh. 2 - Prob. 2.11LBCh. 2 - Prob. 2.12LB
Ch. 2 - Prob. 2.14LBCh. 2 - The file UTILITY contains the following data about...Ch. 2 - One operation of a mill to cut pieces of steel...Ch. 2 - Prob. 2.21ACCh. 2 - Prob. 2.23ACCh. 2 - Prob. 2.25ACCh. 2 - Prob. 2.26ACCh. 2 - The following table indicates the percentage of...Ch. 2 - Prob. 2.29ACCh. 2 - Prob. 2.30ACCh. 2 - Prob. 2.31ACCh. 2 - Prob. 2.32ACCh. 2 - Prob. 2.33LBCh. 2 - Prob. 2.34LBCh. 2 - Prob. 2.35ACCh. 2 - The file UTILITY contains the following data about...Ch. 2 - Prob. 2.39ACCh. 2 - Prob. 2.43ACCh. 2 - The data stored in DRINK represents the amount of...Ch. 2 - Prob. 2.48LBCh. 2 - Prob. 2.49LBCh. 2 - Prob. 2.50ACCh. 2 - Data were collected on the typical cost of dining...Ch. 2 - Prob. 2.53ACCh. 2 - Prob. 2.54ACCh. 2 - Prob. 2.55ACCh. 2 - Prob. 2.56ACCh. 2 - Using the sample of retirement funds stored in...Ch. 2 - Prob. 2.59ACCh. 2 - Using the sample of retirement funds stored in...Ch. 2 - Using the sample of retirement funds stored in...Ch. 2 - Prob. 2.62ACCh. 2 - Prob. 2.70ACCh. 2 - Prob. 2.71ACCh. 2 - Prob. 2.72ACCh. 2 - Prob. 2.73ACCh. 2 - Prob. 2.75ACCh. 2 - Prob. 2.76ACCh. 2 - Prob. 2.77CYUCh. 2 - Prob. 2.78CYUCh. 2 - What are the advantages and disadvantages of using...Ch. 2 - Compare and contrast the bar chart for categorical...Ch. 2 - Prob. 2.81CYUCh. 2 - Prob. 2.82CYUCh. 2 - What are the three different ways to break down...Ch. 2 - How can a multidimensional table differ from a...Ch. 2 - Prob. 2.85CYUCh. 2 - Prob. 2.89CRPCh. 2 - The owner of a restaurant that serves...Ch. 2 - Suppose that the owner of the restaurant in...Ch. 2 - Prob. 2.94CRPCh. 2 - One of the major measures of the quality of...Ch. 2 - Prob. 2.103CRPCh. 2 - Prob. 2.104CRPCh. 2 - Prob. 2.105CRPCh. 2 - Prob. 2.109RWE
Additional Math Textbook Solutions
Find more solutions based on key concepts
For Exercises 13–18, write the negation of the statement.
13. The cell phone is out of juice.
Math in Our World
The largest polynomial that divides evenly into a list of polynomials is called the _______.
Elementary & Intermediate Algebra
1. How is a sample related to a population?
Elementary Statistics: Picturing the World (7th Edition)
Check Your Understanding
Reading Check Complete each sentence using > or < for □.
RC1. 3 dm □ 3 dam
Basic College Mathematics
Knowledge Booster


Learn more about
Need a deep-dive on the concept behind this application? Look no further. Learn more about this topic, statistics and related others by exploring similar questions and additional content below.Similar questions
- AP1.1 You look at real estate ads for houses in Sarasota, Florida. Many houses range from $200,000 to $400,000 in price. The few houses on the water, however, have prices up to $15 million. Which of the following statements best describes the distribution of home prices in Sarasota? The distribution is most likely skewed to the left, and the mean is greater than the median. The distribution is most likely skewed to the left, and the mean is less than the median. The distribution is roughly symmetric with a few high outliers, and the mean is approximately equal to the median. The distribution is most likely skewed to the right, and the mean is greater than the median. The distribution is most likely skewed to the right, and the mean is less than the median.arrow_forwardDuring busy political seasons, many opinion polls are conducted. In apresidential race, how do you think the participants in polls are generally selected?Discuss any issues regarding simple random, stratified, systematic, cluster, andconvenience sampling in these polls. What about other types of polls, besides political?arrow_forwardPlease could you explain why 0.5 was added to each upper limpit of the intervals.Thanksarrow_forward
- 28. (a) Under what conditions do we say that two random variables X and Y are independent? (b) Demonstrate that if X and Y are independent, then it follows that E(XY) = E(X)E(Y); (e) Show by a counter example that the converse of (ii) is not necessarily true.arrow_forward1. Let X and Y be random variables and suppose that A = F. Prove that Z XI(A)+YI(A) is a random variable.arrow_forward30. (a) What is meant by the term "product measur"? ANDarrow_forward
arrow_back_ios
SEE MORE QUESTIONS
arrow_forward_ios
Recommended textbooks for you
 Glencoe Algebra 1, Student Edition, 9780079039897...AlgebraISBN:9780079039897Author:CarterPublisher:McGraw Hill
 Holt Mcdougal Larson Pre-algebra: Student Edition...AlgebraISBN:9780547587776Author:HOLT MCDOUGALPublisher:HOLT MCDOUGAL
 Big Ideas Math A Bridge To Success Algebra 1: Stu...AlgebraISBN:9781680331141Author:HOUGHTON MIFFLIN HARCOURTPublisher:Houghton Mifflin Harcourt
Glencoe Algebra 1, Student Edition, 9780079039897...
Algebra
ISBN:9780079039897
Author:Carter
Publisher:McGraw Hill
Holt Mcdougal Larson Pre-algebra: Student Edition...
Algebra
ISBN:9780547587776
Author:HOLT MCDOUGAL
Publisher:HOLT MCDOUGAL
Big Ideas Math A Bridge To Success Algebra 1: Stu...
Algebra
ISBN:9781680331141
Author:HOUGHTON MIFFLIN HARCOURT
Publisher:Houghton Mifflin Harcourt
Probability & Statistics (28 of 62) Basic Definitions and Symbols Summarized; Author: Michel van Biezen;https://www.youtube.com/watch?v=21V9WBJLAL8;License: Standard YouTube License, CC-BY
Introduction to Probability, Basic Overview - Sample Space, & Tree Diagrams; Author: The Organic Chemistry Tutor;https://www.youtube.com/watch?v=SkidyDQuupA;License: Standard YouTube License, CC-BY