
Elementary Statistics: A Step By Step Approach
10th Edition
ISBN: 9781259755330
Author: Allan G. Bluman
Publisher: McGraw-Hill Education
expand_more
expand_more
format_list_bulleted
Videos
Textbook Question
Chapter 2, Problem 2.3.23RE
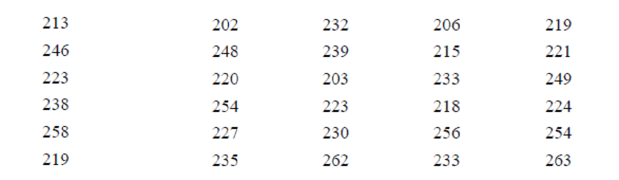
Weights of Football Players A local football team has 30 players; the weight of each player is shown. Construct a stem and leaf plot for the data. Use stems 20__, 21__, 22__, etc.
Expert Solution & Answer
Want to see the full answer?
Check out a sample textbook solution
Students have asked these similar questions
«
CENGAGE MINDTAP
Quiz: Chapter 38
Assignment: Quiz: Chapter 38
ips
Questions ra1kw08h_ch38.15m
13.
14.
15.
O
Which sentence has modifiers in the correct place?
O a. When called, she for a medical emergency responds quickly.
b. Without giving away too much of the plot, Helena described the heroine's actions in the film.
O c. Nearly the snakebite victim died before the proper antitoxin was injected.
. O
O
16
16.
O
17.
18.
O
19.
O
20
20.
21
21.
22.
22
DS
23.
23
24.
25.
O
O
O
Questions ra1kw08h_ch36.14m
12.
13.
14.
15.
16.
Ӧ
17.
18.
19.
OS
20.
Two separate sentences need
Oa. two separate subjects.
Ob. two dependent clauses.
c. one shared subject.
Customers experiencing technical difficulty with their Internet cable service may call an 800 number for technical support. It takes the technician between 30 seconds and 11 minutes to resolve the problem. The distribution of this support time follows the uniform distribution.
Required:
a. What are the values for a and b in minutes?
Note: Do not round your intermediate calculations. Round your answers to 1 decimal place.
b-1. What is the mean time to resolve the problem?
b-2. What is the standard deviation of the time?
c. What percent of the problems take more than 5 minutes to resolve?
d. Suppose we wish to find the middle 50% of the problem-solving times. What are the end points of these two times?
Chapter 2 Solutions
Elementary Statistics: A Step By Step Approach
Ch. 2.1 - Ages of Presidents at Inauguration The data...Ch. 2.1 - List five reasons for organizing data into a...Ch. 2.1 - Name the three types of frequency distributions,...Ch. 2.1 - How many classes should frequency distributions...Ch. 2.1 - What are open-ended frequency distributions? Why...Ch. 2.1 - For Exercises 58, find the class boundaries,...Ch. 2.1 - For Exercises 58, find the class boundaries,...Ch. 2.1 - For Exercises 58, find the class boundaries,...Ch. 2.1 - For Exercises 58, find the class boundaries,...Ch. 2.1 - For Exercises 912, show frequency distributions...
Ch. 2.1 - For Exercises 912, show frequency distributions...Ch. 2.1 - For Exercises 912, show frequency distributions...Ch. 2.1 - For Exercises 912, show frequency distributions...Ch. 2.1 - Favorite Coffee Flavor A survey was taken asking...Ch. 2.1 - Trust in Internet Information A survey was taken...Ch. 2.1 - Eating at Fast Food Restaurants A survey was taken...Ch. 2.1 - Ages of Dogs The ages of 20 dogs in a pet shelter...Ch. 2.1 - Maximum Wind Speeds The data show the maximum wind...Ch. 2.1 - Stories in the Worlds Tallest Buildings The number...Ch. 2.1 - Ages of Declaration of Independence Signers The...Ch. 2.1 - Salaries of Governors Here are the salaries (in...Ch. 2.1 - Charity Donations A random sample of 30 large...Ch. 2.1 - Unclaimed Expired Prizes The number of unclaimed...Ch. 2.1 - Scores in the Rose Bowl The data show the scores...Ch. 2.1 - Consumption of Natural Gas Construct a frequency...Ch. 2.1 - Average Wind Speeds A sample of 40 large cities...Ch. 2.1 - Percentage of People Who Completed 4 or More Years...Ch. 2.1 - JFK Assassination A researcher conducted a survey...Ch. 2.1 - The Value of Pi The ratio of the circumference of...Ch. 2.2 - Selling Real Estate Assume you are a realtor in...Ch. 2.2 - Do Students Need Summer Development? For 108...Ch. 2.2 - Bear Kills The number of bears killed in 2014 for...Ch. 2.2 - Pupils Per Teacher The average number of pupils...Ch. 2.2 - Number of College Faculty The number of faculty...Ch. 2.2 - Railroad Crossing Accidents The data show the...Ch. 2.2 - NFL Salaries The salaries (in millions of dollars)...Ch. 2.2 - Suspension Bridges Spans The following frequency...Ch. 2.2 - Costs of Utilities The frequency distribution...Ch. 2.2 - Air Pollution One of the air pollutants that is...Ch. 2.2 - Making the Grade The frequency distributions shown...Ch. 2.2 - Blood Glucose Levels The frequency distribution...Ch. 2.2 - Waiting Times The frequency distribution shows the...Ch. 2.2 - Construct a histogram, frequency polygon, and...Ch. 2.2 - Construct a histogram, frequency polygon, and...Ch. 2.2 - Construct a histogram, frequency polygon, and...Ch. 2.2 - Construct a histogram, frequency polygon, and...Ch. 2.2 - Home Runs The data show the most number of home...Ch. 2.2 - Protein Grams in Fast Food The amount of protein...Ch. 2.2 - Using the histogram shown here, do the following....Ch. 2.2 - Using the results from Exercise 19. answer these...Ch. 2.2 - Math SAT Scores Shown is an ogive depicting the...Ch. 2.3 - Applying the Concepts 23 Causes of Accidental...Ch. 2.3 - Tech Company Employees Construct a vertical and...Ch. 2.3 - Worldwide Sales of Fast Foods The worldwide sales...Ch. 2.3 - Gulf Coastlines Construct a Pareto chart for the...Ch. 2.3 - Roller Coaster Mania The World Roller Coaster...Ch. 2.3 - Online Ad Spending The amount spent (in billions...Ch. 2.3 - Violent Crimes The number of all violent crimes...Ch. 2.3 - U.S. Licensed Drivers 70 or Older Draw a time...Ch. 2.3 - Valentines Day Spending The data show the average...Ch. 2.3 - Credit Cards Draw and analyze a pie graph for the...Ch. 2.3 - Reasons We Travel The following data are based on...Ch. 2.3 - Kids and Guns The following data show where...Ch. 2.3 - Colors of Automobiles The popular car colors are...Ch. 2.3 - Ages of Football Players The data show the ages of...Ch. 2.3 - Teacher Strikes In Pennsylvania the numbers of...Ch. 2.3 - Years of Experience The data show the number of...Ch. 2.3 - Commuting Times Fifty off-campus students were...Ch. 2.3 - Home Run Club There are 43 Major League baseball...Ch. 2.3 - Calories in Salad Dressings A listing of calories...Ch. 2.3 - Length of Major Rivers The data show the lengths...Ch. 2.3 - Math and Reading Achievement Scores The math and...Ch. 2.3 - State which type of graph (Pareto chart, time...Ch. 2.3 - State which graph (Pareto chart, time series...Ch. 2.3 - U.S. Health Dollar The U.S. health dollar is spent...Ch. 2.3 - Prob. 24ECh. 2.3 - Cost of Milk The graph shows the increase in the...Ch. 2.3 - U.S. Population by Age The following information...Ch. 2.3 - Chicago Homicides Draw and compare two time series...Ch. 2.3 - Trip Reimbursements The average amount requested...Ch. 2 - How People Get Their News The Brunswick Research...Ch. 2 - Mens World Hockey Champions The United States won...Ch. 2 - BUN Count The blood urea nitrogen (BUN) count of...Ch. 2 - Wind Speed The data show the average wind speed...Ch. 2 - Waterfall Heights The data show the heights (in...Ch. 2 - Ages of the Vice Presidents at the Time of Their...Ch. 2 - Find the relative frequency for the frequency...Ch. 2 - Find the relative frequency for the frequency...Ch. 2 - Construct a histogram, frequency polygon, and...Ch. 2 - Construct a histogram, frequency polygon, and...Ch. 2 - Construct a histogram, frequency polygon, and...Ch. 2 - Construct a histogram, frequency polygon, and...Ch. 2 - Non-Alcoholic Beverages The data show the yearly...Ch. 2 - Calories of Nuts The data show the number of...Ch. 2 - Crime The data show the percentage of the types of...Ch. 2 - AID: 1825 | 31/5/2018 16. Pet Care The data (in...Ch. 2 - Broadway Stage Engagements The data show the...Ch. 2 - High School Dropout Rate The data show the high...Ch. 2 - Prob. 2.3.19RECh. 2 - Smart Phone Insurance Construct and analyze a pie...Ch. 2 - Prob. 2.3.21RECh. 2 - Prob. 2.3.22RECh. 2 - Weights of Football Players A local football team...Ch. 2 - Public Libraries The numbers of public libraries...Ch. 2 - Pain Relief The graph below shows the time it...Ch. 2 - Casino Payoffs The graph shows the payoffs...Ch. 2 - From the Data Bank located in Appendix B, choose...Ch. 2 - Prob. 2DACh. 2 - From the Data Bank, select at least 30 subjects...Ch. 2 - Prob. 4DACh. 2 - Using the data from Data Set XI in Appendix B,...Ch. 2 - Prob. 7DACh. 2 - Determine whether each statement is true or false....Ch. 2 - Prob. 2CQCh. 2 - Prob. 3CQCh. 2 - Frequency distributions can aid the researcher in...Ch. 2 - Determine whether each statement is true or false....Ch. 2 - Prob. 6CQCh. 2 - Determine whether each statement is true or false....Ch. 2 - Prob. 8CQCh. 2 - What are the boundaries for 8.68.8? a. 89 b....Ch. 2 - What graph should be used to show the relationship...Ch. 2 - Prob. 11CQCh. 2 - The three types of frequency distributions are...Ch. 2 - In a frequency distribution, the number of classes...Ch. 2 - Prob. 14CQCh. 2 - Data collected over a period of time can be...Ch. 2 - A statistical device used in exploratory data...Ch. 2 - On a Pareto chart, the frequencies should be...Ch. 2 - Housing Arrangements A questionnaire on housing...Ch. 2 - Housing Arrangements A questionnaire on housing...Ch. 2 - Prob. 20CQCh. 2 - Construct a histogram, a frequency polygon, and an...Ch. 2 - Coal Consumption The following data represent the...Ch. 2 - Construct a histogram, frequency polygon, and...Ch. 2 - Recycled Trash Construct a Pareto chart and a...Ch. 2 - Identity Thefts The results of a survey of 84...Ch. 2 - Needless Deaths of Children The New England...Ch. 2 - Prob. 27CQCh. 2 - Parking Meter Revenue In a small city the number...Ch. 2 - Prob. 29CQCh. 2 - The Great Lakes Shown are various statistics about...Ch. 2 - Teacher Strikes In Pennsylvania there were more...
Knowledge Booster


Learn more about
Need a deep-dive on the concept behind this application? Look no further. Learn more about this topic, statistics and related others by exploring similar questions and additional content below.Similar questions
- Exercise 6-6 (Algo) (LO6-3) The director of admissions at Kinzua University in Nova Scotia estimated the distribution of student admissions for the fall semester on the basis of past experience. Admissions Probability 1,100 0.5 1,400 0.4 1,300 0.1 Click here for the Excel Data File Required: What is the expected number of admissions for the fall semester? Compute the variance and the standard deviation of the number of admissions. Note: Round your standard deviation to 2 decimal places.arrow_forward1. Find the mean of the x-values (x-bar) and the mean of the y-values (y-bar) and write/label each here: 2. Label the second row in the table using proper notation; then, complete the table. In the fifth and sixth columns, show the 'products' of what you're multiplying, as well as the answers. X y x minus x-bar y minus y-bar (x minus x-bar)(y minus y-bar) (x minus x-bar)^2 xy 16 20 34 4-2 5 2 3. Write the sums that represents Sxx and Sxy in the table, at the bottom of their respective columns. 4. Find the slope of the Regression line: bi = (simplify your answer) 5. Find the y-intercept of the Regression line, and then write the equation of the Regression line. Show your work. Then, BOX your final answer. Express your line as "y-hat equals...arrow_forwardApply STATA commands & submit the output for each question only when indicated below i. Generate the log of birthweight and family income of children. Name these new variables Ibwght & Ifaminc. Include the output of this code. ii. Apply the command sum with the detail option to the variable faminc. Note: you should find the 25th percentile value, the 50th percentile and the 75th percentile value of faminc from the output - you will need it to answer the next question Include the output of this code. iii. iv. Use the output from part ii of this question to Generate a variable called "high_faminc" that takes a value 1 if faminc is less than or equal to the 25th percentile, it takes the value 2 if faminc is greater than 25th percentile but less than or equal to the 50th percentile, it takes the value 3 if faminc is greater than 50th percentile but less than or equal to the 75th percentile, it takes the value 4 if faminc is greater than the 75th percentile. Include the outcome of this code…arrow_forward
- solve this on paperarrow_forwardApply STATA commands & submit the output for each question only when indicated below i. Apply the command egen to create a variable called "wyd" which is the rowtotal function on variables bwght & faminc. ii. Apply the list command for the first 10 observations to show that the code in part i worked. Include the outcome of this code iii. Apply the egen command to create a new variable called "bwghtsum" using the sum function on variable bwght by the variable high_faminc (Note: need to apply the bysort' statement) iv. Apply the "by high_faminc" statement to find the V. descriptive statistics of bwght and bwghtsum Include the output of this code. Why is there a difference between the standard deviations of bwght and bwghtsum from part iv of this question?arrow_forwardAccording to a health information website, the distribution of adults’ diastolic blood pressure (in millimeters of mercury, mmHg) can be modeled by a normal distribution with mean 70 mmHg and standard deviation 20 mmHg. b. Above what diastolic pressure would classify someone in the highest 1% of blood pressures? Show all calculations used.arrow_forward
- Write STATA codes which will generate the outcomes in the questions & submit the output for each question only when indicated below i. ii. iii. iv. V. Write a code which will allow STATA to go to your favorite folder to access your files. Load the birthweight1.dta dataset from your favorite folder and save it under a different filename to protect data integrity. Call the new dataset babywt.dta (make sure to use the replace option). Verify that it contains 2,998 observations and 8 variables. Include the output of this code. Are there missing observations for variable(s) for the variables called bwght, faminc, cigs? How would you know? (You may use more than one code to show your answer(s)) Include the output of your code (s). Write the definitions of these variables: bwght, faminc, male, white, motheduc,cigs; which of these variables are categorical? [Hint: use the labels of the variables & the browse command] Who is this dataset about? Who can use this dataset to answer what kind of…arrow_forwardApply STATA commands & submit the output for each question only when indicated below İ. ii. iii. iv. V. Apply the command summarize on variables bwght and faminc. What is the average birthweight of babies and family income of the respondents? Include the output of this code. Apply the tab command on the variable called male. How many of the babies and what share of babies are male? Include the output of this code. Find the summary statistics (i.e. use the sum command) of the variables bwght and faminc if the babies are white. Include the output of this code. Find the summary statistics (i.e. use the sum command) of the variables bwght and faminc if the babies are male but not white. Include the output of this code. Using your answers to previous subparts of this question: What is the difference between the average birthweight of a baby who is male and a baby who is male but not white? What can you say anything about the difference in family income of the babies that are male and male…arrow_forwardA public health researcher is studying the impacts of nudge marketing techniques on shoppers vegetablesarrow_forward
- The director of admissions at Kinzua University in Nova Scotia estimated the distribution of student admissions for the fall semester on the basis of past experience. Admissions Probability 1,100 0.5 1,400 0.4 1,300 0.1 Click here for the Excel Data File Required: What is the expected number of admissions for the fall semester? Compute the variance and the standard deviation of the number of admissions. Note: Round your standard deviation to 2 decimal places.arrow_forwardA pollster randomly selected four of 10 available people. Required: How many different groups of 4 are possible? What is the probability that a person is a member of a group? Note: Round your answer to 3 decimal places.arrow_forwardWind Mountain is an archaeological study area located in southwestern New Mexico. Potsherds are broken pieces of prehistoric Native American clay vessels. One type of painted ceramic vessel is called Mimbres classic black-on-white. At three different sites the number of such sherds was counted in local dwelling excavations. Test given. Site I Site II Site III 63 19 60 43 34 21 23 49 51 48 11 15 16 46 26 20 31 Find .arrow_forward
arrow_back_ios
SEE MORE QUESTIONS
arrow_forward_ios
Recommended textbooks for you
 Glencoe Algebra 1, Student Edition, 9780079039897...AlgebraISBN:9780079039897Author:CarterPublisher:McGraw Hill
 Holt Mcdougal Larson Pre-algebra: Student Edition...AlgebraISBN:9780547587776Author:HOLT MCDOUGALPublisher:HOLT MCDOUGAL
 Big Ideas Math A Bridge To Success Algebra 1: Stu...AlgebraISBN:9781680331141Author:HOUGHTON MIFFLIN HARCOURTPublisher:Houghton Mifflin Harcourt
 Algebra & Trigonometry with Analytic GeometryAlgebraISBN:9781133382119Author:SwokowskiPublisher:Cengage
Glencoe Algebra 1, Student Edition, 9780079039897...
Algebra
ISBN:9780079039897
Author:Carter
Publisher:McGraw Hill
Holt Mcdougal Larson Pre-algebra: Student Edition...
Algebra
ISBN:9780547587776
Author:HOLT MCDOUGAL
Publisher:HOLT MCDOUGAL
Big Ideas Math A Bridge To Success Algebra 1: Stu...
Algebra
ISBN:9781680331141
Author:HOUGHTON MIFFLIN HARCOURT
Publisher:Houghton Mifflin Harcourt
Algebra & Trigonometry with Analytic Geometry
Algebra
ISBN:9781133382119
Author:Swokowski
Publisher:Cengage
Grade 12 and UG/ Introduction to logical statements and truth tables; Author: Dr Trefor Bazett;https://www.youtube.com/watch?v=q2eyZZK-OIk;License: Standard YouTube License, CC-BY