Principles of Geotechnical Engineering (MindTap Course List)
9th Edition
ISBN: 9781305970939
Author: Braja M. Das, Khaled Sobhan
Publisher: Cengage Learning
expand_more
expand_more
format_list_bulleted
Concept explainers
Textbook Question
Chapter 2, Problem 2.14P
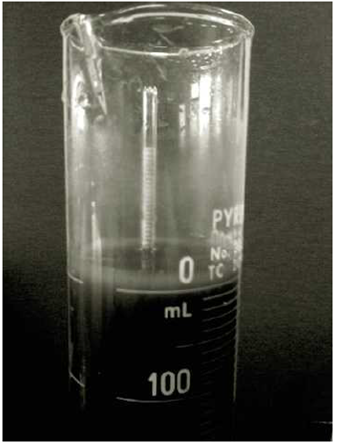
A hydrometer test has the following result: Gs = 2.65, temperature of water = 26° C, and L = 10.4 cm at 45 minutes after the start of sedimentation (see Figure 2.25). What is the diameter D of the smallest-size particles that have settled beyond the zone of measurement at that time (that is, t = 45 min)?

Figure 2.25 ASTM 152H type of hydrometer placed inside the sedimentation cylinder (Courtesy of Khaled Sobhan, Florida Atlantic University, Boca Raton, Florida)
Expert Solution & Answer
Trending nowThis is a popular solution!

Students have asked these similar questions
1. (a) Explain Rankine's Theory of lateral earth pressures (at rest, active and passive) in
terms of Mohr's circles. (6%)
(b) What are the two important assumptions of Rankine in determination of lateral earth
pressures on a retaining structure? (4%)
(c) Show all the pressures acting on the wall below and determine them (30%)
0.5m
10
5.0 m
1.0 m
Sand
Y-18.5 kN/m³
$-36°
Tos m
1.5m
1.0 m
1.0 m
100% sure experts solve it correct complete solutions okk. Not generalized
2) Draw the shear force and bending moment diagrams of the following beam. Use method of areas.
5 t/m
Z
10t
hinge
5 m
|1m|1m|1m
m+
2 m
21
A- All electronic communication tools like mobile phones, computers, tablets, etc. will not be in an open and visible area during the exam. B- According to the provision of Article
(a-5) of the Higher Education Law No. 2547, "Attempting to cheat in exams" is a disciplinary offense that requires "Condemnation punishment". C- According to the provisi
Article 54-(c-5) of the Higher Education Law No. 2547, "Cheating or causing others to cheat in exams" is a disciplinary offense that requires "Suspension from the Hi
Education Institution for one semester". D- According to the provision of Article 54-(d-4) of the Higher Education Law No. 2547, "Cheating in exams by threatening, prever
cheating students from being removed from the exam hall, having someone else take the exam instead of oneself or taking the exam in someone else's place" is a discipl
offense…
Chapter 2 Solutions
Principles of Geotechnical Engineering (MindTap Course List)
Ch. 2 - For a gravel with D60 = 0.48 mm, D30 = 0.25 mm,...Ch. 2 - Prob. 2.2PCh. 2 - Prob. 2.3PCh. 2 - The following are the results of a sieve analysis....Ch. 2 - Repeat Problem 2.4 with the following data. 2.4...Ch. 2 - Repeat Problem 2.4 with the following data. 2.4...Ch. 2 - Repeat Problem 2.4 with the following data. 2.4...Ch. 2 - The following are the results of a sieve and...Ch. 2 - Repeat Problem 2.8 using the following data. 2.8...Ch. 2 - Repeat Problem 2.8 using the following data. 2.8...
Ch. 2 - The grain-size characteristics of a soil are given...Ch. 2 - Repeat Problem 2.11 with the following data. 2.11...Ch. 2 - Repeat Problem 2.11 with the following data. 2.11...Ch. 2 - A hydrometer test has the following result: Gs =...Ch. 2 - Repeat Problem 2.14 with the following values: Gs...Ch. 2 - Three groups of students from the Geotechnical...Ch. 2 - Refer to Problem 2.C.1. Results of the sieve...
Knowledge Booster
Learn more about
Need a deep-dive on the concept behind this application? Look no further. Learn more about this topic, civil-engineering and related others by exploring similar questions and additional content below.Similar questions
- You have been appointed as a safety consultant by Siyakha Civil (Pty) Ltd for their new property development project. Advise them on the safety requirements for the construction of the floors and roofs of the buildings they have designed.arrow_forwardGiven the arrow diagram for a construction project with their dependencies. Draw the precedence diagram for that project. 2 3 B 12 4 16 5 7 (F 80 10 5 9 (H)arrow_forwardTables A1E-A12E are the English-Units versions of the Tables A1-A12. Using these tables, determine the specific volume of water at 500 PSI and 50 °F. Show the steps and draw a diagram (like how we did in class) to determine the phase.arrow_forward
- What is the formula of B coefficient beta T and beta C if you will not use any software ?arrow_forwardA flash drum operating at 300 kPa is separating 1000.0 kmol/h of a mixture that is 40.0 mol% isobutane, 25.0% n-pentane, and 35.0% n-hexane. We wish a 90.0% recovery of n-hexane in the liquid. Find Tdrum, xi, yi, and V/F.arrow_forwardSolve using the method of sectionsarrow_forward
- 6. Draw the shear and moment diagrams for the beam. 10 kN 10 kN/m 1 m 2 m. Aarrow_forward3. Identify and label the key components that make up the low-slope roofing system in the diagram below. (5 points)arrow_forwardASSIGNMENT. 1. The following figure is a billboard sketch, design the members. Hint, the billboard is usually designed against wind loads and its own self weight. For the dimensions, you can visit existing billboards to see usual dimensions. 3D Viewarrow_forward
arrow_back_ios
SEE MORE QUESTIONS
arrow_forward_ios
Recommended textbooks for you
 Principles of Geotechnical Engineering (MindTap C...Civil EngineeringISBN:9781305970939Author:Braja M. Das, Khaled SobhanPublisher:Cengage Learning
 Traffic and Highway EngineeringCivil EngineeringISBN:9781305156241Author:Garber, Nicholas J.Publisher:Cengage Learning
 Fundamentals of Geotechnical Engineering (MindTap...Civil EngineeringISBN:9781305635180Author:Braja M. Das, Nagaratnam SivakuganPublisher:Cengage Learning
 Principles of Foundation Engineering (MindTap Cou...Civil EngineeringISBN:9781305081550Author:Braja M. DasPublisher:Cengage Learning
 Principles of Foundation Engineering (MindTap Cou...Civil EngineeringISBN:9781337705028Author:Braja M. Das, Nagaratnam SivakuganPublisher:Cengage Learning

Principles of Geotechnical Engineering (MindTap C...
Civil Engineering
ISBN:9781305970939
Author:Braja M. Das, Khaled Sobhan
Publisher:Cengage Learning

Traffic and Highway Engineering
Civil Engineering
ISBN:9781305156241
Author:Garber, Nicholas J.
Publisher:Cengage Learning

Fundamentals of Geotechnical Engineering (MindTap...
Civil Engineering
ISBN:9781305635180
Author:Braja M. Das, Nagaratnam Sivakugan
Publisher:Cengage Learning

Principles of Foundation Engineering (MindTap Cou...
Civil Engineering
ISBN:9781305081550
Author:Braja M. Das
Publisher:Cengage Learning

Principles of Foundation Engineering (MindTap Cou...
Civil Engineering
ISBN:9781337705028
Author:Braja M. Das, Nagaratnam Sivakugan
Publisher:Cengage Learning
Hydrogen - the Fuel of the Future?; Author: Real Engineering;https://www.youtube.com/watch?v=iPheEg-K2qc;License: Standard Youtube License