Concept explainers
To estimate: The phylogeny of the given taxa by plotting the changes on each of the possible unrooted trees and determine the tree with fewest evolutionary changes.
Introduction: Three species named 1, 2, and 3 are endemic to a group of islands. They all share a common ancestor named species 4. Species 4 serves as an out group. It has a huge
Explanation of Solution
Deoxyribonucleic acid consists of four nucleotides, these are: adenine (A), thymine (T), guanine (G), and cytosine(C). These nucleotides can be paired and labeled for the given condition as follows:
- GC - a
- AG - b
- GT - c
- AC -d
- AT - e
- TG - f
- CA - g
The data of the nucleotide bases at the ten sequenced sites in the given four species are as follows:

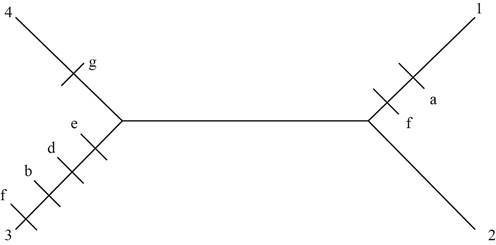
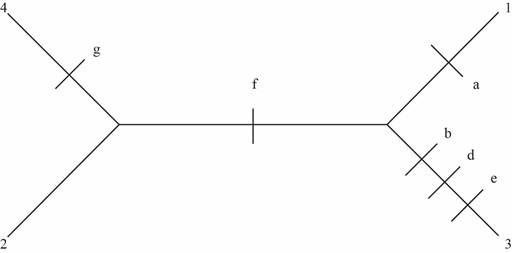
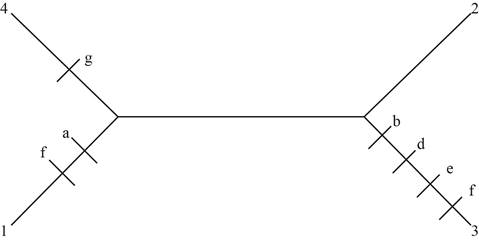
Pictorial representation: Fig.1, Fig.2 and Fig.3 represent the possible unrooted trees for phylogeny of the given taxa.

Fig 1: Seven changes observed in this unrooted tree

Fig 2: Six changes observed in this unrooted tree

Fig 3: Seven changes observed in this unrooted tree
Therefore, the tree with fewest evolutionary changes is the second unrooted tree represented by Fig.2. This tree has only six changes, whereas the other two have seven changes which are higher than the second one.
Want to see more full solutions like this?
Chapter 2 Solutions
Evolution
- There is currently a H5N1 cattle outbreak in North America. According to the CDC on Feb 26*: "A multistate outbreak of HPAI A(H5N1) bird flu in dairy cows was first reported on March 25, 2024. This is the first time that these bird flu viruses had been found in cows. In the United States, since 2022, USDA has reported HPAI A(H5N1) virus detections in more than 200 mammals." List and describe two mechanisms that could lead to this H5N1 influenza strain evolving to spread in human: Mechanisms 1: Mechanisms 2: For the mutations to results in a human epidered they would need to change how the virus interacts with the human host. In the case of mutations that may promote an epidemic, provide an example for: a protein that might incur a mutation: how the mutation would change interactions with cells in the respiratory tract (name the receptor on human cells) List two phenotypic consequence from this mutation that would increase human riskarrow_forwardYou have a bacterial strain with the CMU operon: a) As shown in the image below, the cmu operon encodes a peptide (Pep1), as well as a kinase and regulator corresponding to a two-component system. The cmu operon is activated when Pep 1 is added to the growth media. Pep1 is a peptide that when added extracellularly leads to activation of the Cmu operon. Pep1 cmu-kinase cmu-regulator You also have these genetic components in other strains: b) An alternative sigma factor, with a promoter activated by the cmu-regulator, that control a series of multiple operons that together encode a transformasome (cellular machinery for transformation). c) the gene cl (a repressor). d) the promoter X, which includes a cl binding site (and in the absence of cl is active). e) the gene gp (encoding a green fluorescence protein). Using the cmu operon as a starting point, and assuming you can perform cloning to rearrange any of these genomic features, how would you use one or more of these to modify the…arrow_forwardYou have identified a new species of a Gram-positive bacteria. You would like to screen their genome for all proteins that are covalently linked to the cell wall. You have annotated the genome, so that you identified all the promoters, operons, and genes sequences within the operons. Using these features, what would you screen for to identify a set of candidates for proteins covalently linked to the bacterial cell wall.arrow_forward
- Below is a diagram from a genomic locus of a bacterial genome. Each arrow represents a coding region, and the arrowheads indicate its orientation in the genome. The numbers are randomly assigned. Draw the following features on the diagram, and explain your rationale for each feature: 10 12 合會會會會長 6 a) Expected transcriptions, based on known properties of bacterial genes and operons. How many proteins are encoded in each of the transcripts? b) Location of promoters (include rationale) c) Location of transcriptional terminators (include rationale) d) Locations of Shine-Dalgarno sequences (include rationale)arrow_forwardSample excuse letter in school class for the reasons of headaches and dysmenorrhea caused by menstrual cyclearrow_forwardHow do the muscles on the foot work to balance on an ice skate, specifically the triangle of balance and how does it change when balancing on an ice skate? (Refer to anatomy, be specific)arrow_forward
- Which of the following is NOT an example of passive immunization? A. Administration of tetanus toxoid B. Administration of hepatitis B immunoglobulin C. Administration of rabies immunoglobulin D. Transfer of antibodies via plasma therapyarrow_forwardTranscription and Translation 1. What is the main function of transcription and translation? (2 marks) 2. How is transcription different in eukaryotic and prokaryotic cells? (2 marks) 3. Explain the difference between pre-mRNA and post-transcript mRNA. (2 marks) 4. What is the function of the following: (4 marks) i. the cap ii. spliceosome iii. Poly A tail iv. termination sequence 5. What are advantages to the wobble feature of the genetic code? (2 marks) 6. Explain the difference between the: (3 marks) i. A site & P site ii. codon & anticodon iii. gene expression and gene regulation 7. Explain how the stop codon allows for termination. (1 mark) 8. In your own words, summarize the process of translation. (2 marks)arrow_forwardIn this activity you will research performance enhancers that affect the endocrine system or nervous system. You will submit a 1 page paper on one performance enhancer of your choice. Be sure to include: the specific reason for use the alleged results on improving performance how it works how it affect homeostasis and improves performance any side-effects of this substancearrow_forward
- Neurons and Reflexes 1. Describe the function of the: a) dendrite b) axon c) cell body d) myelin sheath e) nodes of Ranvier f) Schwann cells g) motor neuron, interneuron and sensory neuron 2. List some simple reflexes. Explain why babies are born with simple reflexes. What are they and why are they necessary. 3. Explain why you only feel pain after a few seconds when you touch something very hot but you have already pulled your hand away. 4. What part of the brain receives sensory information? What part of the brain directs you to move your hand away? 5. In your own words describe how the axon fires.arrow_forwardMutations Here is your template DNA strand: CTT TTA TAG TAG ATA CCA CAA AGG 1. Write out the complementary mRNA that matches the DNA above. 2. Write the anticodons and the amino acid sequence. 3. Change the nucleotide in position #15 to C. 4. What type of mutation is this? 5. Repeat steps 1 & 2. 6. How has this change affected the amino acid sequence? 7. Now remove nucleotides 13 through 15. 8. Repeat steps 1 & 2. 9. What type of mutation is this? 0. Do all mutations result in a change in the amino acid sequence? 1. Are all mutations considered bad? 2. The above sequence codes for a genetic disorder called cystic fibrosis (CF). 3. When A is changed to G in position #15, the person does not have CF. When T is changed to C in position #14, the person has the disorder. How could this have originated?arrow_forwardhoose a scientist(s) and research their contribution to our derstanding of DNA structure or replication. Write a one page port and include: their research where they studied and the time period in which they worked their experiments and results the contribution to our understanding of DNA cientists Watson & Crickarrow_forward
 Human Heredity: Principles and Issues (MindTap Co...BiologyISBN:9781305251052Author:Michael CummingsPublisher:Cengage Learning
 Biology (MindTap Course List)BiologyISBN:9781337392938Author:Eldra Solomon, Charles Martin, Diana W. Martin, Linda R. BergPublisher:Cengage Learning
 Biology: The Dynamic Science (MindTap Course List)BiologyISBN:9781305389892Author:Peter J. Russell, Paul E. Hertz, Beverly McMillanPublisher:Cengage Learning
 Biology 2eBiologyISBN:9781947172517Author:Matthew Douglas, Jung Choi, Mary Ann ClarkPublisher:OpenStax
 Human Biology (MindTap Course List)BiologyISBN:9781305112100Author:Cecie Starr, Beverly McMillanPublisher:Cengage Learning
 Concepts of BiologyBiologyISBN:9781938168116Author:Samantha Fowler, Rebecca Roush, James WisePublisher:OpenStax College


