For Questions 1 through 3, interpret the position graph given in each figure by writing a very short “story” of what is happening. Be creative! Have characters and situations! Simply saying that “a car moves 100 meters to the right” doesn’t qualify as a story. Your stories should make specific reference to information you obtain from the graph, such as distance moved or time elapsed.
For Questions 1 through 3, interpret the position graph given in each figure by writing a very short “story” of what is happening. Be creative! Have characters and situations! Simply saying that “a car moves 100 meters to the right” doesn’t qualify as a story. Your stories should make specific reference to information you obtain from the graph, such as distance moved or time elapsed.
For Questions 1 through 3, interpret the position graph given in each figure by writing a very short “story” of what is happening. Be creative! Have characters and situations! Simply saying that “a car moves 100 meters to the right” doesn’t qualify as a story. Your stories should make specific reference to information you obtain from the graph, such as distance moved or time elapsed.
Expert Solution & Answer
To determine
Short story which interprets the graph.
Explanation of Solution
Given:
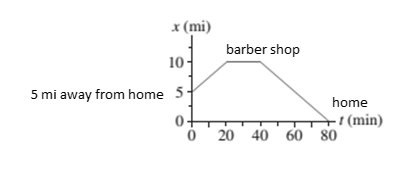
Distance versus time graph.
Paul is 5 mi away from the home at a car shop. He traveled to the barber shop and covered the distance of 5 mi, in further 20 mins he reached a barber shop, where he had a haircut in 20 min. Then, he traveled back home with the same speed and covered 10mi in 40 mins.
Consider the figure of the movement indicating the movement of Paul,
Figure.1
Conclusion:
This figure indicates the movement of Paul, and variation in distance with respect to time.
Want to see more full solutions like this?
Subscribe now to access step-by-step solutions to millions of textbook problems written by subject matter experts!
How is it that part a is connected to part b? I can't seem to solve either part and don't see the connection between the two.
Hello, please help with inputing trial one into the equation, I just need a model for the first one so I can answer the rest. Also, does my data have the correct sigfig?
Thanks!
Find the current in the R₁ resistor in the drawing
(V₁=16.0V, V2=23.0 V, V₂ = 16.0V, R₁ = 2005, R₂ =
and R₂ = 2.705)
2.3052
VIT
A
www
R
www
R₂
R₂
Va
Chapter 2 Solutions
Physics for Scientists and Engineers: A Strategic Approach with Modern Physics, Books a la Carte Edition; Student Workbook for Physics for Scientists ... eText -- ValuePack Access Card (4th Edition)
Human Physiology: An Integrated Approach (8th Edition)
Knowledge Booster
Learn more about
Need a deep-dive on the concept behind this application? Look no further. Learn more about this topic, physics and related others by exploring similar questions and additional content below.


 Physics for Scientists and Engineers with Modern ...PhysicsISBN:9781337553292Author:Raymond A. Serway, John W. JewettPublisher:Cengage Learning
 Glencoe Physics: Principles and Problems, Student...PhysicsISBN:9780078807213Author:Paul W. ZitzewitzPublisher:Glencoe/McGraw-Hill
 Principles of Physics: A Calculus-Based TextPhysicsISBN:9781133104261Author:Raymond A. Serway, John W. JewettPublisher:Cengage Learning
 University Physics Volume 1PhysicsISBN:9781938168277Author:William Moebs, Samuel J. Ling, Jeff SannyPublisher:OpenStax - Rice University
 Physics for Scientists and Engineers: Foundations...PhysicsISBN:9781133939146Author:Katz, Debora M.Publisher:Cengage Learning
 Physics for Scientists and EngineersPhysicsISBN:9781337553278Author:Raymond A. Serway, John W. JewettPublisher:Cengage Learning