
To explain: Characteristics of developing nation.
Explanation of Solution
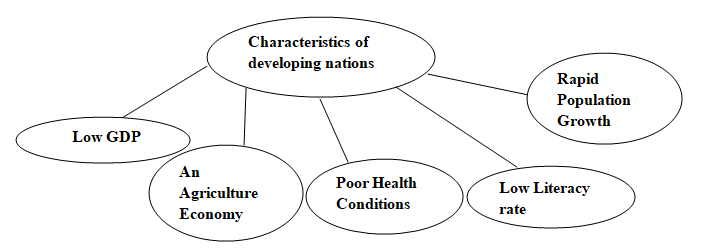
1. Low
2. An Agriculture Economy: Agriculture is considered to be an important sector of developing nations. Most of the population is dependent upon subsistence agriculture, where families grow enough to take care of their wants and needs. This means that there is no crop available for export or for the industrial workforce.
3. Poor Health Conditions: This is very common in developing nations. People die because of malnutrition or illness due to a lack of food. There is also a shortage of hospitals, medicines and good doctors in developing nations. This results in a high infant mortality rate and low life expectancy among adults.
4. Low Literacy Rate: The percentage of people who can read and write is low in the developing nation. This is because of less number of schools and also the children didn't go to school to help their families in farm work. Due to the shortage of educated workers, it is difficult to train people for needed technical and engineering jobs.
5. Rapid Population Growth: Rapid population growth is basically the source of other problems like lack of food and housing. The population growth rate of a developing country is one percent per year whereas the population growth rate of developing countries is three or even four times this rate.
Chapter 19 Solutions
Economics Today and Tomorrow, Student Edition
Additional Business Textbook Solutions
Financial Accounting, Student Value Edition (5th Edition)
Accounting Information Systems (14th Edition)
Principles of Operations Management: Sustainability and Supply Chain Management (10th Edition)
Gitman: Principl Manageri Finance_15 (15th Edition) (What's New in Finance)
Business Essentials (12th Edition) (What's New in Intro to Business)
Horngren's Accounting (12th Edition)

- If 17 Ps are needed and no on-hand inventory exists fot any of thr items, how many Cs will be needed?arrow_forwardExercise 5Consider the demand and supply functions for the notebooks market.QD=10,000−100pQS=900pa. Make a table with the corresponding supply and demand schedule.b. Draw the corresponding graph.c. Is it possible to find the price and quantity of equilibrium with the graph method? d. Find the price and quantity of equilibrium by solving the system of equations.arrow_forward1. Consider the market supply curve which passes through the intercept and from which the marketequilibrium data is known, this is, the price and quantity of equilibrium PE=50 and QE=2000.a. Considering those two points, find the equation of the supply. b. Draw a graph for this equation. 2. Considering the previous supply line, determine if the following demand function corresponds to themarket demand equilibrium stated above. QD=.3000-2p.arrow_forward
- Supply and demand functions show different relationship between the price and quantities suppliedand demanded. Explain the reason for that relation and provide one reference with your answer.arrow_forward13:53 APP 簸洛瞭對照 Vo 56 5G 48% 48% atheva.cc/index/index/index.html The Most Trusted, Secure, Fast, Reliable Cryptocurrency Exchange Get started with the easiest and most secure platform to buy, sell, trade, and earn Cryptocurrency Balance:0.00 Recharge Withdraw Message About us BTC/USDT ETH/USDT EOS/USDT 83241.12 1841.50 83241.12 +1.00% +0.08% +1.00% Operating norms Symbol Latest price 24hFluctuation B BTC/USDT 83241.12 +1.00% ETH/USDT 1841.50 +0.08% B BTC/USD illı 83241.12 +1.00% Home Markets Trade Record Mine О <arrow_forwardThe production function of a firm is described by the following equation Q=10,000L-3L2 where Lstands for the units of labour.a) Draw a graph for this equation. Use the quantity produced in the y-axis, and the units of labour inthe x-axis. b) What is the maximum production level? c) How many units of labour are needed at that point?arrow_forward
- what is change in TC / change in Q? and what would be an example?arrow_forwardhow to solve the attachment?arrow_forwardProblem 3-ABC Challenges: Attrition, Balance and ComplianceCan television inform people about public affairs? Political scientists Bethany Albertson and Adria Lawrence (2009) conducted an experiment in which they randomly assigned people to treatment and control groups to evaluate the effect of watching TV on a person’s information level. Those assigned to the treatment group were told to watch a specific television broadcast and were later asked questions related to what they watched. Those in the controlgroup were not shown the TV broadcast but were asked questions related to the material in the TV broadcast. The dataset contains the following variables: : Dummy variable which =1 if a person reads news and 0 otherwise. : interest in political affairs (not interested=1 to very interested=4) : years of education : female dummy variable (female=1; male=0) : family income in thousands of dollars : information level (low information level=1 to high information level=4) =1 if the…arrow_forward

 Principles of Economics (12th Edition)EconomicsISBN:9780134078779Author:Karl E. Case, Ray C. Fair, Sharon E. OsterPublisher:PEARSON
 Engineering Economy (17th Edition)EconomicsISBN:9780134870069Author:William G. Sullivan, Elin M. Wicks, C. Patrick KoellingPublisher:PEARSON
 Principles of Economics (MindTap Course List)EconomicsISBN:9781305585126Author:N. Gregory MankiwPublisher:Cengage Learning
 Managerial Economics: A Problem Solving ApproachEconomicsISBN:9781337106665Author:Luke M. Froeb, Brian T. McCann, Michael R. Ward, Mike ShorPublisher:Cengage Learning
 Managerial Economics & Business Strategy (Mcgraw-...EconomicsISBN:9781259290619Author:Michael Baye, Jeff PrincePublisher:McGraw-Hill Education