Videos
(a)
The P-V diagram.
(a)
Answer to Problem 74P
The P-V diagram is shown in figure 1.
Explanation of Solution
Given:
The initial pressure is
The initial volume is
The final volume is
Calculation:
Consider the given data, the pressure versus volume graph for the process is shown below.
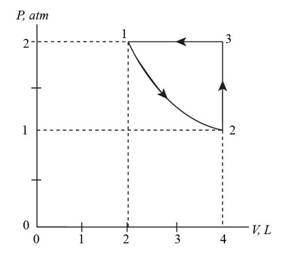
Figure 1
Conclusion:
Therefore, the P-V diagram is shown in figure 1.
(b)
The temperature at end of each part of cycle.
(b)
Answer to Problem 74P
The temperature at the end of cycle 1, 2 and 3 are
Explanation of Solution
Formula used:
The expression for temperature for portion 1 is given by,
The expression for temperature for portion 2 is given by,
The expression for temperature for portion 3 is given by,
Calculation:
The temperature for portion1 is calculated as,
The temperature for portion2 is calculated as,
The temperature for portion3 is calculated as,
Conclusion:
Therefore, the temperature at the end of cycle 1, 2 and 3 are
(c)
The head absorbed and work done during each cycle.
(c)
Answer to Problem 74P
The heat absorbed for process 1, 2 and 3 are
Explanation of Solution
Formula used:
The expression for heat absorbed for portion 1 is given by,
The expression for heat absorbed for portion 2 is given by,
The expression for heat absorbed for portion 3 is given by,
The expression for work for portion 1 is given by,
The expression for work done for portion 3 is given by,
Calculation:
The heat absorbed for portion1 is calculated as,
The work done for portion1 is calculated as,
The heat absorbed for portion2 is calculated as,
The heat absorbed for portion3 is calculated as,
The work done for portion2 is zero because it is process with constant volume.
The work done for portion3 is calculated as,
Conclusion:
Therefore, the heat absorbed for process 1, 2 and 3 are
Want to see more full solutions like this?
Chapter 18 Solutions
PHYSICS F/SCI.+ENGRS.,STAND.-W/ACCESS


- A circular coil with 100 turns and a radius of 0.05 m is placed in a magnetic field that changes at auniform rate from 0.2 T to 0.8 T in 0.1 seconds. The plane of the coil is perpendicular to the field.• Calculate the induced electric field in the coil.• Calculate the current density in the coil given its conductivity σ.arrow_forwardAn L-C circuit has an inductance of 0.410 H and a capacitance of 0.250 nF . During the current oscillations, the maximum current in the inductor is 1.80 A . What is the maximum energy Emax stored in the capacitor at any time during the current oscillations? How many times per second does the capacitor contain the amount of energy found in part A? Please show all steps.arrow_forwardA long, straight wire carries a current of 10 A along what we’ll define to the be x-axis. A square loopin the x-y plane with side length 0.1 m is placed near the wire such that its closest side is parallel tothe wire and 0.05 m away.• Calculate the magnetic flux through the loop using Ampere’s law.arrow_forward
- Describe the motion of a charged particle entering a uniform magnetic field at an angle to the fieldlines. Include a diagram showing the velocity vector, magnetic field lines, and the path of the particle.arrow_forwardDiscuss the differences between the Biot-Savart law and Coulomb’s law in terms of their applicationsand the physical quantities they describe.arrow_forwardExplain why Ampere’s law can be used to find the magnetic field inside a solenoid but not outside.arrow_forward
- 3. An Atwood machine consists of two masses, mA and m B, which are connected by an inelastic cord of negligible mass that passes over a pulley. If the pulley has radius RO and moment of inertia I about its axle, determine the acceleration of the masses mA and m B, and compare to the situation where the moment of inertia of the pulley is ignored. Ignore friction at the axle O. Use angular momentum and torque in this solutionarrow_forwardA 0.850-m-long metal bar is pulled to the right at a steady 5.0 m/s perpendicular to a uniform, 0.650-T magnetic field. The bar rides on parallel metal rails connected through a 25-Ω, resistor (Figure 1), so the apparatus makes a complete circuit. Ignore the resistance of the bar and the rails. Please explain how to find the direction of the induced current.arrow_forwardFor each of the actions depicted, determine the direction (right, left, or zero) of the current induced to flow through the resistor in the circuit containing the secondary coil. The coils are wrapped around a plastic core. Immediately after the switch is closed, as shown in the figure, (Figure 1) in which direction does the current flow through the resistor? If the switch is then opened, as shown in the figure, in which direction does the current flow through the resistor? I have the answers to the question, but would like to understand the logic behind the answers. Please show steps.arrow_forward
- When violet light of wavelength 415 nm falls on a single slit, it creates a central diffraction peak that is 8.60 cm wide on a screen that is 2.80 m away. Part A How wide is the slit? ΟΙ ΑΣΦ ? D= 2.7.10-8 Submit Previous Answers Request Answer × Incorrect; Try Again; 8 attempts remaining marrow_forwardTwo complex values are z1=8 + 8i, z2=15 + 7 i. z1∗ and z2∗ are the complex conjugate values. Any complex value can be expessed in the form of a+bi=reiθ. Find θ for (z1-z∗2)/z1+z2∗. Find r and θ for (z1−z2∗)z1z2∗ Please show all stepsarrow_forwardCalculate the center of mass of the hollow cone shown below. Clearly specify the origin and the coordinate system you are using. Z r Y h Xarrow_forward
 Principles of Physics: A Calculus-Based TextPhysicsISBN:9781133104261Author:Raymond A. Serway, John W. JewettPublisher:Cengage Learning
 Physics for Scientists and Engineers: Foundations...PhysicsISBN:9781133939146Author:Katz, Debora M.Publisher:Cengage Learning
 Physics for Scientists and Engineers, Technology ...PhysicsISBN:9781305116399Author:Raymond A. Serway, John W. JewettPublisher:Cengage Learning
 College PhysicsPhysicsISBN:9781285737027Author:Raymond A. Serway, Chris VuillePublisher:Cengage Learning
 Physics for Scientists and Engineers with Modern ...PhysicsISBN:9781337553292Author:Raymond A. Serway, John W. JewettPublisher:Cengage Learning