
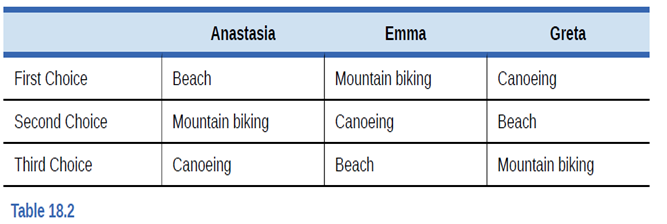
Anastasia, Emma, and Greta are deciding what to do on a weekend getaway. They each suggest a first, second, and third choice and then vote on the options. Table 18.2 shows their first, second, and third choice preferences. Explain why they will have a hard time teaching a decision. Does the group prefer mountain biking to canoeing? What about canoeing compared to the beach? What about the beach compared to the original choice of mountain biking?

Trending nowThis is a popular solution!

Chapter 18 Solutions
Principles of Economics 2e
Additional Business Textbook Solutions
Financial Accounting (12th Edition) (What's New in Accounting)
MARKETING:REAL PEOPLE,REAL CHOICES
Engineering Economy (17th Edition)
Managerial Accounting (5th Edition)
Business Essentials (12th Edition) (What's New in Intro to Business)
Gitman: Principl Manageri Finance_15 (15th Edition) (What's New in Finance)

- Not use ai pleasearrow_forwardIn the following table, complete the third column by determining the quantity sold in each country at a price of $18 per toy train. Next, complete the fourth column by calculating the total profit and the profit from each country under a single price. Price Single Price Quantity Sold Price Discrimination Country (Dollars per toy train) (Millions of toy trains) Profit (Millions of dollars) Price (Dollars per toy train) Quantity Sold (Millions of toy trains) Profit (Millions of dollars) France 18 Russia 18 Total N/A N/A N/A N/A Suppose that as a profit-maximizing firm, Le Jouet decides to price discriminate by charging a different price in each market, while its marginal cost of production remains $8 per toy. Complete the last three columns in the previous table by determining the profit-maximizing price, the quantity sold at that price, the profit in each country, and total profit if Le Jouet price discriminates. Le Jouet charges a lower price in the market with a relatively elastic…arrow_forwardNot use ai pleasearrow_forward
- Not dhdjdjdjduudnxnxjfjfi feverarrow_forwardDiscuss the different types of resources (natural, human, capital) and how they are allocated in an economy. Identify which resources are scarce and which are abundant, and explain the implications of this scarcity or abundance.arrow_forwardNot use ai pleasearrow_forward
- Not use ai please letarrow_forwardLocation should be in GWAGWALADA Abuja Nigeria Use the Internet to do itarrow_forwardUsing data from 1988 for houses sold in Andover, Massachusetts, from Kiel and McClain (1995), the following equation relates housing price (price) to the distance from a recently built garbage incinerator (dist): = log(price) 9.40 + 0.312 log(dist) n = 135, R2 = 0.162. Interpretation of the slope coefficient? ► How would our interpretation of the slope coefficient change if distance were measured in metres instead of kilometres?arrow_forward
- If GDP goes up by 1% and the investment component of GDPgoes up by more than 1%, how is the investment share ofGDP changing in absolute terms?▶ In economics, what else is expressed as relative percentagechanges?arrow_forwardCEO Salary and Firm SalesWe can estimate a constant elasticity model relating CEO salary to firm sales. The data set is the same one used in Example 2.3, except we now relate salary to sales. Let sales be annual firm sales, measured in millions of dollars. A constant elasticity model is[2.45]ßßlog (salary) = ß0 + ß0log (sales) + u,where ß1 is the elasticity of salary with respect to sales. This model falls under the simple regression model by defining the dependent variable to be y = log(salary) and the independent variable to be x = log1sales2. Estimating this equation by OLS gives[2.46]log (salary)^=4.822 + 0.257 (sales) n = 209, R2 = 0.211.The coefficient of log(sales) is the estimated elasticity of salary with respect to sales. It implies that a 1% increase in firm sales increases CEO salary by about 0.257%—the usual interpretation of an elasticity.arrow_forwardSolvearrow_forward
 Economics (MindTap Course List)EconomicsISBN:9781337617383Author:Roger A. ArnoldPublisher:Cengage Learning

 Principles of Economics 2eEconomicsISBN:9781947172364Author:Steven A. Greenlaw; David ShapiroPublisher:OpenStax
 Microeconomics: Principles & PolicyEconomicsISBN:9781337794992Author:William J. Baumol, Alan S. Blinder, John L. SolowPublisher:Cengage Learning
 Economics Today and Tomorrow, Student EditionEconomicsISBN:9780078747663Author:McGraw-HillPublisher:Glencoe/McGraw-Hill School Pub Co