
Statistical Techniques in Business and Economics
16th Edition
ISBN: 9780077639723
Author: Lind
Publisher: Mcgraw-Hill Course Content Delivery
expand_more
expand_more
format_list_bulleted
Concept explainers
Videos
Textbook Question
Chapter 18, Problem 3SR
Sales at Tomlin Manufacturing from 2009 to 2013 are:
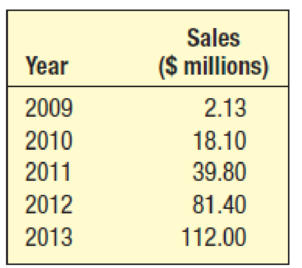
- (a) Determine the logarithmic trend equation for the sales data.
- (b) Sales increased by what percentage annually from 2009–2013?
- (c) What is the projected sales amount for 2014?
Expert Solution & Answer
Want to see the full answer?
Check out a sample textbook solution
Students have asked these similar questions
math
Compute the median of the following data.
32, 41, 36, 42, 29, 30, 40, 22, 25, 37
Task Description:
Read the following case study and answer the questions that follow.
Ella is a 9-year-old third-grade student in an inclusive classroom. She has been diagnosed with Emotional and Behavioural Disorder (EBD). She has been struggling academically and socially due to
challenges related to self-regulation, impulsivity, and emotional outbursts. Ella's behaviour includes frequent tantrums, defiance toward authority figures, and difficulty forming positive relationships with peers. Despite her challenges, Ella shows an interest in art and creative activities and demonstrates strong verbal skills when calm.
Describe 2 strategies that could be implemented that could help Ella regulate her emotions in class (4 marks)
Explain 2 strategies that could improve Ella’s social skills (4 marks)
Identify 2 accommodations that could be implemented to support Ella academic progress and provide a rationale for your recommendation.(6 marks)
Provide a detailed explanation of 2 ways…
Chapter 18 Solutions
Statistical Techniques in Business and Economics
Ch. 18 - Prob. 1SRCh. 18 - Calculate a four-quarter weighted moving average...Ch. 18 - Prob. 2ECh. 18 - Prob. 2SRCh. 18 - Prob. 3ECh. 18 - Prob. 4ECh. 18 - Prob. 5ECh. 18 - Prob. 6ECh. 18 - Sales at Tomlin Manufacturing from 2009 to 2013...Ch. 18 - Prob. 7E
Ch. 18 - Prob. 8ECh. 18 - Prob. 4SRCh. 18 - Prob. 9ECh. 18 - Prob. 10ECh. 18 - Prob. 5SRCh. 18 - Prob. 11ECh. 18 - Prob. 12ECh. 18 - Refer to Exercise 9 regarding the absences at...Ch. 18 - Prob. 14ECh. 18 - Prob. 15ECh. 18 - Prob. 16ECh. 18 - Prob. 17CECh. 18 - Prob. 18CECh. 18 - Prob. 19CECh. 18 - Prob. 20CECh. 18 - Prob. 21CECh. 18 - Prob. 22CECh. 18 - Prob. 23CECh. 18 - Prob. 24CECh. 18 - Prob. 25CECh. 18 - Prob. 26CECh. 18 - Prob. 27CECh. 18 - The quarterly production of pine lumber, in...Ch. 18 - Prob. 29CECh. 18 - Sales of roof material, by quarter, for 2007...Ch. 18 - Blueberry Farms Golf and Fish Club of Hilton Head,...Ch. 18 - Prob. 32CECh. 18 - Ray Anderson, owner of Anderson Ski Lodge in...Ch. 18 - Prob. 34CECh. 18 - Prob. 35CECh. 18 - Prob. 36CECh. 18 - Consider the variable mean amount per transaction...Ch. 18 - Prob. 38CECh. 18 - Prob. 39DECh. 18 - Prob. 1PCh. 18 - Prob. 2PCh. 18 - Prob. 3PCh. 18 - Prob. 1.1PTCh. 18 - Prob. 1.2PTCh. 18 - Prob. 1.3PTCh. 18 - Prob. 1.4PTCh. 18 - Prob. 1.5PTCh. 18 - Prob. 1.6PTCh. 18 - Prob. 1.7PTCh. 18 - Prob. 1.8PTCh. 18 - Prob. 1.9PTCh. 18 - Prob. 1.10PTCh. 18 - Prob. 2.1PTCh. 18 - Listed below are the price and quantity of several...Ch. 18 - Prob. 2.3PT
Knowledge Booster


Learn more about
Need a deep-dive on the concept behind this application? Look no further. Learn more about this topic, statistics and related others by exploring similar questions and additional content below.Similar questions
- Question 2: When John started his first job, his first end-of-year salary was $82,500. In the following years, he received salary raises as shown in the following table. Fill the Table: Fill the following table showing his end-of-year salary for each year. I have already provided the end-of-year salaries for the first three years. Calculate the end-of-year salaries for the remaining years using Excel. (If you Excel answer for the top 3 cells is not the same as the one in the following table, your formula / approach is incorrect) (2 points) Geometric Mean of Salary Raises: Calculate the geometric mean of the salary raises using the percentage figures provided in the second column named “% Raise”. (The geometric mean for this calculation should be nearly identical to the arithmetic mean. If your answer deviates significantly from the mean, it's likely incorrect. 2 points) Starting salary % Raise Raise Salary after raise 75000 10% 7500 82500 82500 4% 3300…arrow_forwardI need help with this problem and an explanation of the solution for the image described below. (Statistics: Engineering Probabilities)arrow_forwardI need help with this problem and an explanation of the solution for the image described below. (Statistics: Engineering Probabilities)arrow_forward
- 310015 K Question 9, 5.2.28-T Part 1 of 4 HW Score: 85.96%, 49 of 57 points Points: 1 Save of 6 Based on a poll, among adults who regret getting tattoos, 28% say that they were too young when they got their tattoos. Assume that six adults who regret getting tattoos are randomly selected, and find the indicated probability. Complete parts (a) through (d) below. a. Find the probability that none of the selected adults say that they were too young to get tattoos. 0.0520 (Round to four decimal places as needed.) Clear all Final check Feb 7 12:47 US Oarrow_forwardhow could the bar graph have been organized differently to make it easier to compare opinion changes within political partiesarrow_forwardDraw a picture of a normal distribution with mean 70 and standard deviation 5.arrow_forward
- What do you guess are the standard deviations of the two distributions in the previous example problem?arrow_forwardPlease answer the questionsarrow_forward30. An individual who has automobile insurance from a certain company is randomly selected. Let Y be the num- ber of moving violations for which the individual was cited during the last 3 years. The pmf of Y isy | 1 2 4 8 16p(y) | .05 .10 .35 .40 .10 a.Compute E(Y).b. Suppose an individual with Y violations incurs a surcharge of $100Y^2. Calculate the expected amount of the surcharge.arrow_forward
- 24. An insurance company offers its policyholders a num- ber of different premium payment options. For a ran- domly selected policyholder, let X = the number of months between successive payments. The cdf of X is as follows: F(x)=0.00 : x < 10.30 : 1≤x<30.40 : 3≤ x < 40.45 : 4≤ x <60.60 : 6≤ x < 121.00 : 12≤ x a. What is the pmf of X?b. Using just the cdf, compute P(3≤ X ≤6) and P(4≤ X).arrow_forward59. At a certain gas station, 40% of the customers use regular gas (A1), 35% use plus gas (A2), and 25% use premium (A3). Of those customers using regular gas, only 30% fill their tanks (event B). Of those customers using plus, 60% fill their tanks, whereas of those using premium, 50% fill their tanks.a. What is the probability that the next customer will request plus gas and fill the tank (A2 B)?b. What is the probability that the next customer fills the tank?c. If the next customer fills the tank, what is the probability that regular gas is requested? Plus? Premium?arrow_forward38. Possible values of X, the number of components in a system submitted for repair that must be replaced, are 1, 2, 3, and 4 with corresponding probabilities .15, .35, .35, and .15, respectively. a. Calculate E(X) and then E(5 - X).b. Would the repair facility be better off charging a flat fee of $75 or else the amount $[150/(5 - X)]? [Note: It is not generally true that E(c/Y) = c/E(Y).]arrow_forward
arrow_back_ios
SEE MORE QUESTIONS
arrow_forward_ios
Recommended textbooks for you

01 - What Is A Differential Equation in Calculus? Learn to Solve Ordinary Differential Equations.; Author: Math and Science;https://www.youtube.com/watch?v=K80YEHQpx9g;License: Standard YouTube License, CC-BY
Higher Order Differential Equation with constant coefficient (GATE) (Part 1) l GATE 2018; Author: GATE Lectures by Dishank;https://www.youtube.com/watch?v=ODxP7BbqAjA;License: Standard YouTube License, CC-BY
Solution of Differential Equations and Initial Value Problems; Author: Jefril Amboy;https://www.youtube.com/watch?v=Q68sk7XS-dc;License: Standard YouTube License, CC-BY