
Statistical Techniques in Business and Economics
16th Edition
ISBN: 9780077639723
Author: Lind
Publisher: Mcgraw-Hill Course Content Delivery
expand_more
expand_more
format_list_bulleted
Videos
Textbook Question
Chapter 18, Problem 13E
Refer to Exercise 9 regarding the absences at Anderson Belts, Inc. Use the seasonal indexes you computed to determine the deseasonalized absences. Determine the linear trend equation based on the quarterly data for the 3 years. Forecast the seasonally adjusted absences for 2014.
9. Victor Anderson, the owner of Anderson Belts Inc., is studying absenteeism among his employees. His workforce is small, consisting of only five employees. For the last 3 years, 2011 through 2013, he recorded the following number of employee absences, in days, for each quarter.
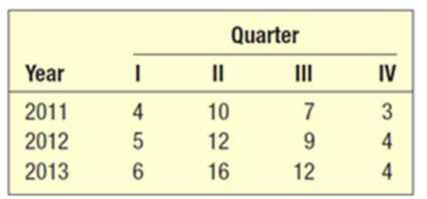
Determine a typical seasonal index for each of the four quarters.
Expert Solution & Answer
Want to see the full answer?
Check out a sample textbook solution
Students have asked these similar questions
Suppose you know that Bob's test score is
above the mean, but he doesn't remember by
how much. At least how many students must
score lower than Bob?
If a baby's weight is at the median, what's
her percentile?
At the same restaurant as in Question 19 with
the same normal distribution, what's the
chance of it taking no more than 15 minutes
to get service?
Chapter 18 Solutions
Statistical Techniques in Business and Economics
Ch. 18 - Prob. 1SRCh. 18 - Calculate a four-quarter weighted moving average...Ch. 18 - Prob. 2ECh. 18 - Prob. 2SRCh. 18 - Prob. 3ECh. 18 - Prob. 4ECh. 18 - Prob. 5ECh. 18 - Prob. 6ECh. 18 - Sales at Tomlin Manufacturing from 2009 to 2013...Ch. 18 - Prob. 7E
Ch. 18 - Prob. 8ECh. 18 - Prob. 4SRCh. 18 - Prob. 9ECh. 18 - Prob. 10ECh. 18 - Prob. 5SRCh. 18 - Prob. 11ECh. 18 - Prob. 12ECh. 18 - Refer to Exercise 9 regarding the absences at...Ch. 18 - Prob. 14ECh. 18 - Prob. 15ECh. 18 - Prob. 16ECh. 18 - Prob. 17CECh. 18 - Prob. 18CECh. 18 - Prob. 19CECh. 18 - Prob. 20CECh. 18 - Prob. 21CECh. 18 - Prob. 22CECh. 18 - Prob. 23CECh. 18 - Prob. 24CECh. 18 - Prob. 25CECh. 18 - Prob. 26CECh. 18 - Prob. 27CECh. 18 - The quarterly production of pine lumber, in...Ch. 18 - Prob. 29CECh. 18 - Sales of roof material, by quarter, for 2007...Ch. 18 - Blueberry Farms Golf and Fish Club of Hilton Head,...Ch. 18 - Prob. 32CECh. 18 - Ray Anderson, owner of Anderson Ski Lodge in...Ch. 18 - Prob. 34CECh. 18 - Prob. 35CECh. 18 - Prob. 36CECh. 18 - Consider the variable mean amount per transaction...Ch. 18 - Prob. 38CECh. 18 - Prob. 39DECh. 18 - Prob. 1PCh. 18 - Prob. 2PCh. 18 - Prob. 3PCh. 18 - Prob. 1.1PTCh. 18 - Prob. 1.2PTCh. 18 - Prob. 1.3PTCh. 18 - Prob. 1.4PTCh. 18 - Prob. 1.5PTCh. 18 - Prob. 1.6PTCh. 18 - Prob. 1.7PTCh. 18 - Prob. 1.8PTCh. 18 - Prob. 1.9PTCh. 18 - Prob. 1.10PTCh. 18 - Prob. 2.1PTCh. 18 - Listed below are the price and quantity of several...Ch. 18 - Prob. 2.3PT
Knowledge Booster


Learn more about
Need a deep-dive on the concept behind this application? Look no further. Learn more about this topic, statistics and related others by exploring similar questions and additional content below.Similar questions
- Clint, obviously not in college, sleeps an average of 8 hours per night with a standard deviation of 15 minutes. What's the chance of him sleeping between 7.5 and 8.5 hours on any given night? 0-(7-0) 200 91109s and doiw $20 (8-0) mol 8520 slang $199 galbrog seam side pide & D (newid se od poyesvig as PELEO PER AFTE editiw noudab temand van Czarrow_forwardTimes to complete a statistics exam have a normal distribution with a mean of 40 minutes and standard deviation of 6 minutes. Deshawn's time comes in at the 90th percentile. What percentage of the students are still working on their exams when Deshawn leaves?arrow_forwardSuppose that the weights of cereal boxes have a normal distribution with a mean of 20 ounces and standard deviation of half an ounce. A box that has a standard score of o weighs how much? syed by ilog ni 21arrow_forward
- Bob scores 80 on both his math exam (which has a mean of 70 and standard deviation of 10) and his English exam (which has a mean of 85 and standard deviation of 5). Find and interpret Bob's Z-scores on both exams to let him know which exam (if either) he did bet- ter on. Don't, however, let his parents know; let them think he's just as good at both subjects. algas 70) sering digarrow_forwardSue's math class exam has a mean of 70 with a standard deviation of 5. Her standard score is-2. What's her original exam score?arrow_forwardClint sleeps an average of 8 hours per night with a standard deviation of 15 minutes. What's the chance he will sleep less than 7.5 hours tonight? nut bow visarrow_forward
- Suppose that your score on an exam is directly at the mean. What's your standard score?arrow_forwardOne state's annual rainfall has a normal dis- tribution with a mean of 100 inches and standard deviation of 25 inches. Suppose that corn grows best when the annual rainfall is between 100 and 150 inches. What's the chance of achieving this amount of rainfall? wved now of sociarrow_forward13 Suppose that your exam score has a standard score of 0.90. Does this mean that 90 percent of the other exam scores are lower than yours?arrow_forward
- Bob's commuting times to work have a nor- mal distribution with a mean of 45 minutes and standard deviation of 10 minutes. How often does Bob get to work in 30 to 45 minutes?arrow_forwardBob's commuting times to work have a nor- mal distribution with a mean of 45 minutes and standard deviation of 10 minutes. a. What percentage of the time does Bob get to work in 30 minutes or less? b. Bob's workday starts at 9 a.m. If he leaves at 8 a.m., how often is he late?arrow_forwardSuppose that you want to put fat Fido on a weight-loss program. Before the program, his weight had a standard score of +2 com- pared to dogs of his breed/age, and after the program, his weight has a standard score of -2. His weight before the program was 150 pounds, and the standard deviation for the breed is 5 pounds. a. What's the mean weight for Fido's breed/ age? b. What's his weight after the weight-loss program?arrow_forward
arrow_back_ios
SEE MORE QUESTIONS
arrow_forward_ios
Recommended textbooks for you
 Glencoe Algebra 1, Student Edition, 9780079039897...AlgebraISBN:9780079039897Author:CarterPublisher:McGraw Hill
 Big Ideas Math A Bridge To Success Algebra 1: Stu...AlgebraISBN:9781680331141Author:HOUGHTON MIFFLIN HARCOURTPublisher:Houghton Mifflin Harcourt
 College Algebra (MindTap Course List)AlgebraISBN:9781305652231Author:R. David Gustafson, Jeff HughesPublisher:Cengage Learning
 Trigonometry (MindTap Course List)TrigonometryISBN:9781305652224Author:Charles P. McKeague, Mark D. TurnerPublisher:Cengage Learning
 Elementary AlgebraAlgebraISBN:9780998625713Author:Lynn Marecek, MaryAnne Anthony-SmithPublisher:OpenStax - Rice University
Glencoe Algebra 1, Student Edition, 9780079039897...
Algebra
ISBN:9780079039897
Author:Carter
Publisher:McGraw Hill
Big Ideas Math A Bridge To Success Algebra 1: Stu...
Algebra
ISBN:9781680331141
Author:HOUGHTON MIFFLIN HARCOURT
Publisher:Houghton Mifflin Harcourt
College Algebra (MindTap Course List)
Algebra
ISBN:9781305652231
Author:R. David Gustafson, Jeff Hughes
Publisher:Cengage Learning
Trigonometry (MindTap Course List)
Trigonometry
ISBN:9781305652224
Author:Charles P. McKeague, Mark D. Turner
Publisher:Cengage Learning
Elementary Algebra
Algebra
ISBN:9780998625713
Author:Lynn Marecek, MaryAnne Anthony-Smith
Publisher:OpenStax - Rice University
Time Series Analysis Theory & Uni-variate Forecasting Techniques; Author: Analytics University;https://www.youtube.com/watch?v=_X5q9FYLGxM;License: Standard YouTube License, CC-BY
Operations management 101: Time-series, forecasting introduction; Author: Brandoz Foltz;https://www.youtube.com/watch?v=EaqZP36ool8;License: Standard YouTube License, CC-BY