
Concept explainers
Videos
With respect to the periodic waveform sketched in Fig. 17.30, let gn(t) represent the Fourier series representation of f(t) truncated at n. [For example, if n = 1, g1(t) has three terms, defined through a0, a1 and b1.] (a) Sketch g2(t), g3(t), and g5(t), along with f(t). (b) Calculate f (2.5), g2(2.5), g3(2.5), and g5(2.5).
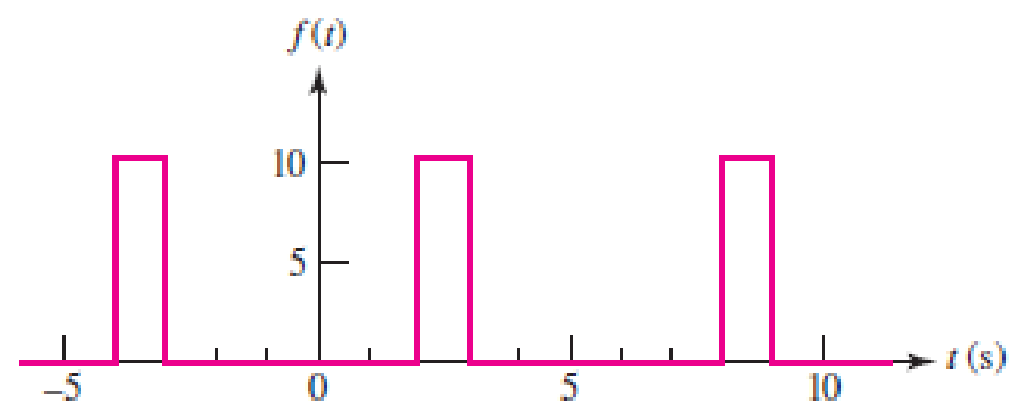
■ FIGURE 17.30
(a)
Sketch
Answer to Problem 8E
The sketch for
Explanation of Solution
Given data:
Refer to Figure 17.30 in the textbook.
Formula used:
Write the general expression for Fourier series expansion.
Write the general expression for Fourier series coefficient
Write the general expression for Fourier series coefficient
Write the general expression for Fourier series coefficient
Write the expression to calculate the fundamental angular frequency.
Here,
Calculation:
In the given Figure 17.29, the time period is
Substitute 6 for T in equation (5) to find
Substitute 6 for T in equation (2) to find the value of coefficient
Simplify the above equation as follows,
Substitute 6 for T in equation (3) to find the value of coefficient
The above equation as follows,
Substitute equation (6) in equation (7) as follows,
Now finding the Fourier coefficient
Substitute 6 for T in equation (4) to find the value of coefficient
The above equation as follows,
Substitute equation (6) in equation (9) as follows,
Substituting the value of
The function
For
Therefore, equation (11) will be as follows,
Simplify the above equation as follows,
Similarly, for
Therefore, equation (11) will be as follows,
From equation (12), the above equation is written as,
Similarly, for
Therefore, equation (11) will be as follows,
From equation (13), the above equation is written as,
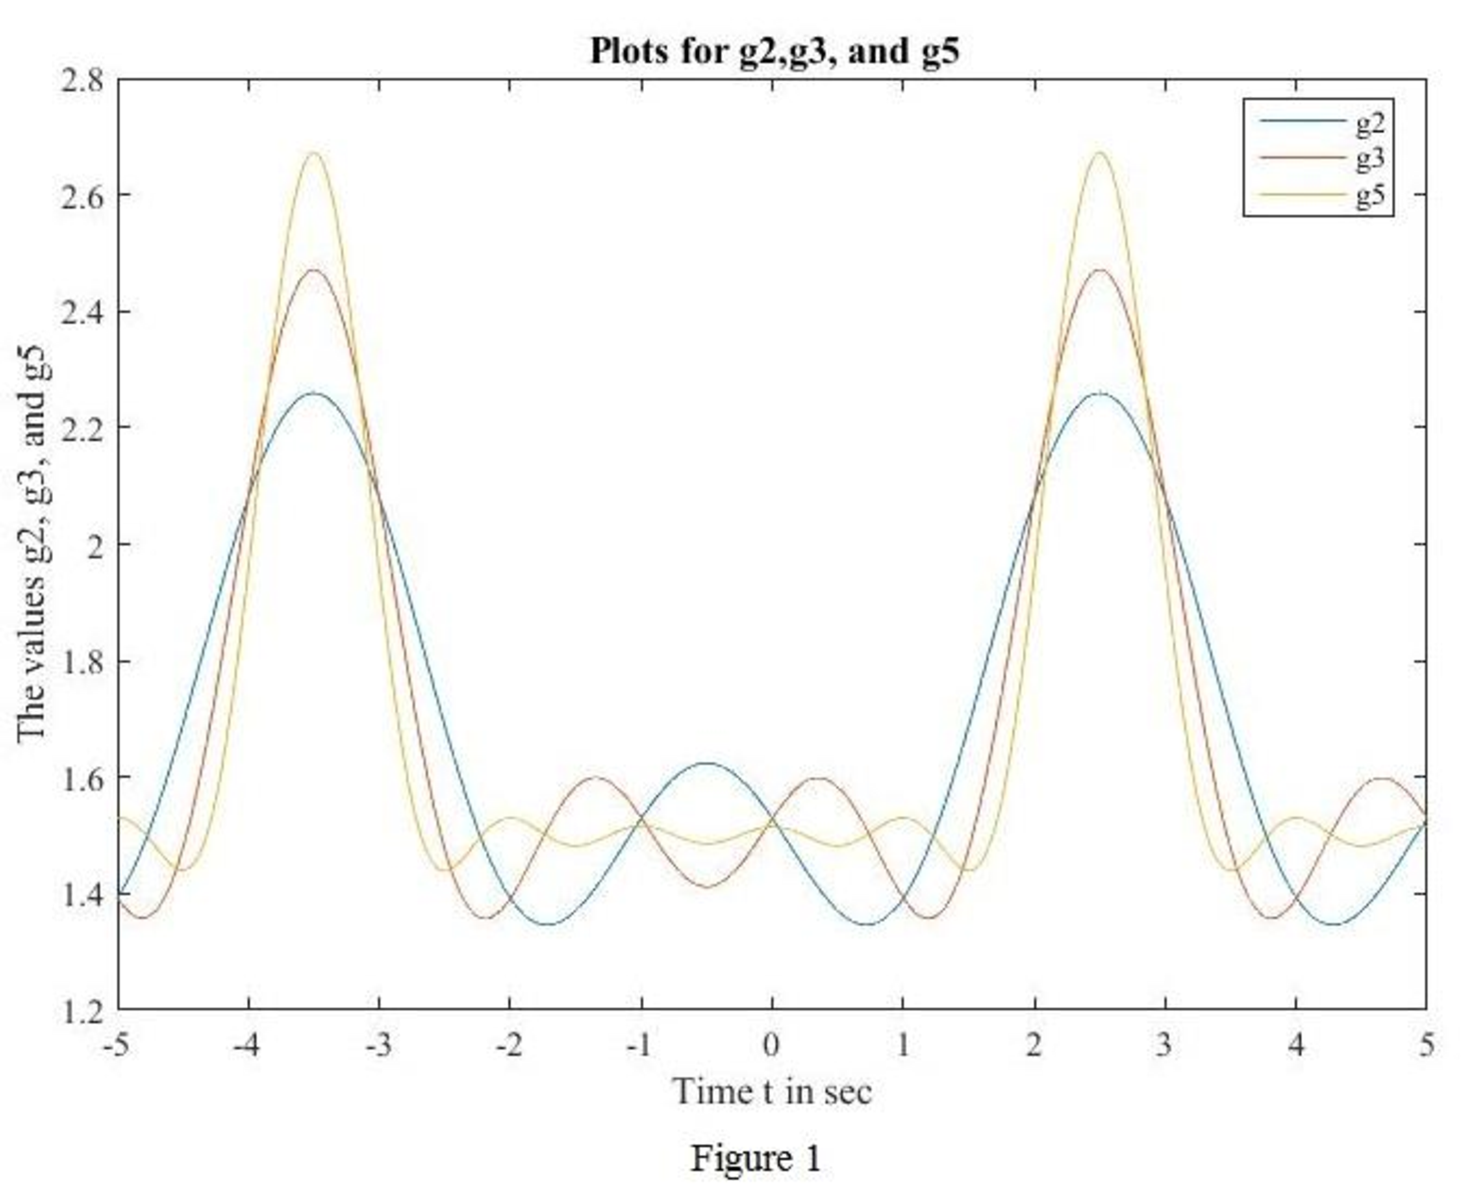
MATLAB code to sketch for
t=-5:0.01:5;
g2=1.667-0.275*cos(3.141*t/3)+0.159*sin(3.141*t/3)+0.137*cos(2*3.141*t/3)-0.238*sin(2*3.141*t/3);
g3=1.667-0.275*cos(3.141*t/3)+0.159*sin(3.141*t/3)+0.137*cos(2*3.141*t/3)-0.238*sin(2*3.141*t/3)+0.212*sin(pi*t);
g5=1.667- 0.275*cos(3.141*t/3)+0.159*sin(3.141*t/3)+0.137*cos(2*3.141*t/3)-0.238*sin(2*3.141*t/3)+0.212*sin(pi*t)-0.069*cos(4*pi*t/3)-0.119*sin(4*pi*t/3)+0.055*cos(5*pi*t/3)+0.0318*sin(5*pi*t/3);
plot(t,g2,t,g3,t,g5)
legend({'g2','g3','g5'},'Location','best')
xlabel('Time t in sec')
ylabel('The values g2, g3, and g5')
title('Plots for g2,g3, and g5')
MATLAB output: The MATLAB output shown in Figure 1.
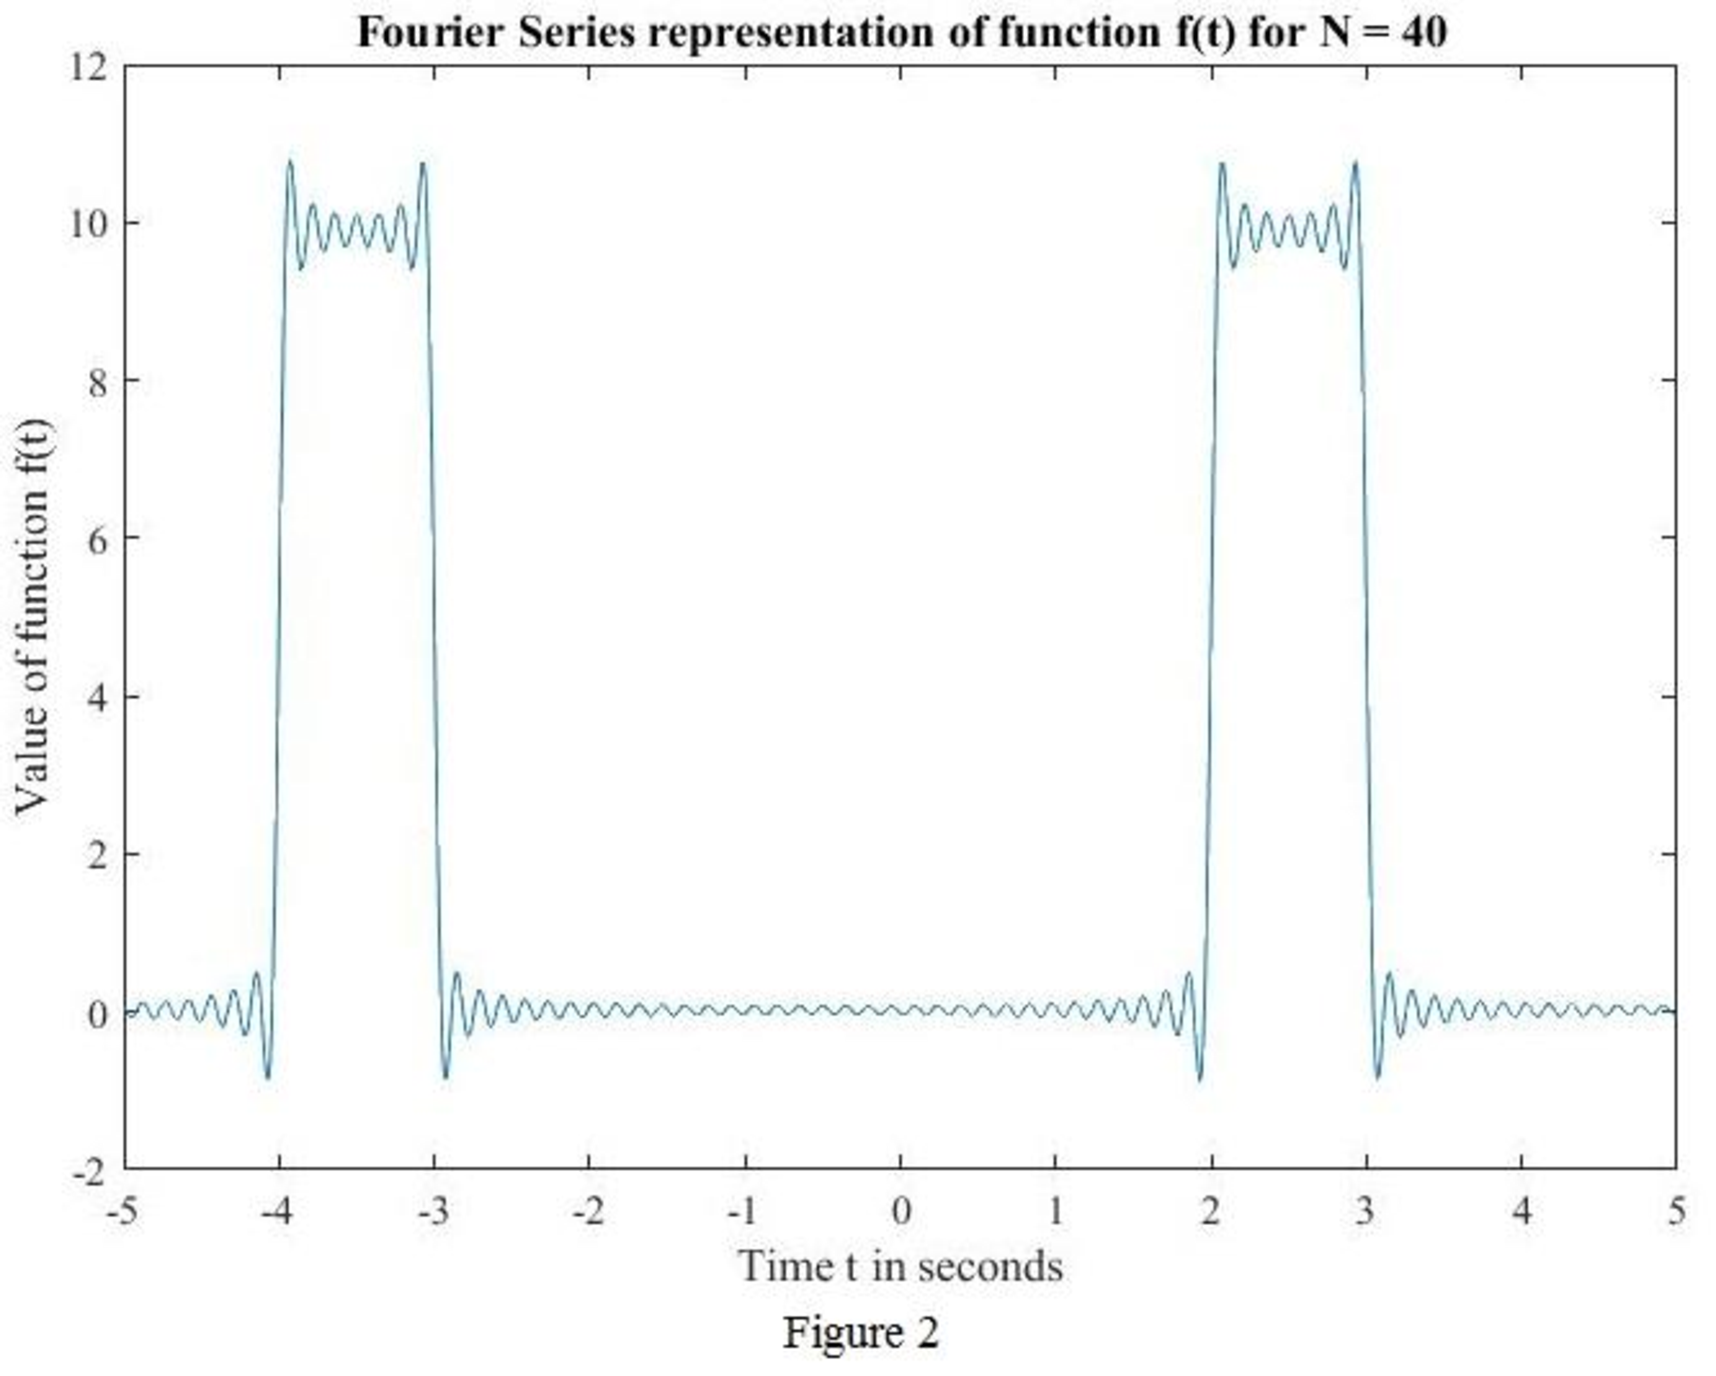
MATLAB code to sketch for
t=linspace(-5,5,1000); % vector for time over 1000 points.
T=6; % Period
w0=2*pi/T; % natural frequency, is w0=2*pi.
f0=1.667; % constant.
N=40;
for i=1:1000;
sum=0;
for n=1:N;
sum=sum+(1/n*pi)*(sin(n*pi) -sin(2*n*pi/3))*cos(n*pi*t(i)/3) + (1/n*pi)*(cos(2*n*pi/3) -cos(n*pi))*sin(n*pi*t(i)/3);
end
f40(i)=f0+sum;
end
plot(t,f40)
xlabel('Time t in seconds')
ylabel('Value of function f(t)')
plot_ttle = ['Fourier Series representation of function f(t) for N = ',num2str(N)];
title(plot_ttle);
MATLAB output: The MATLAB output shown in Figure 2.
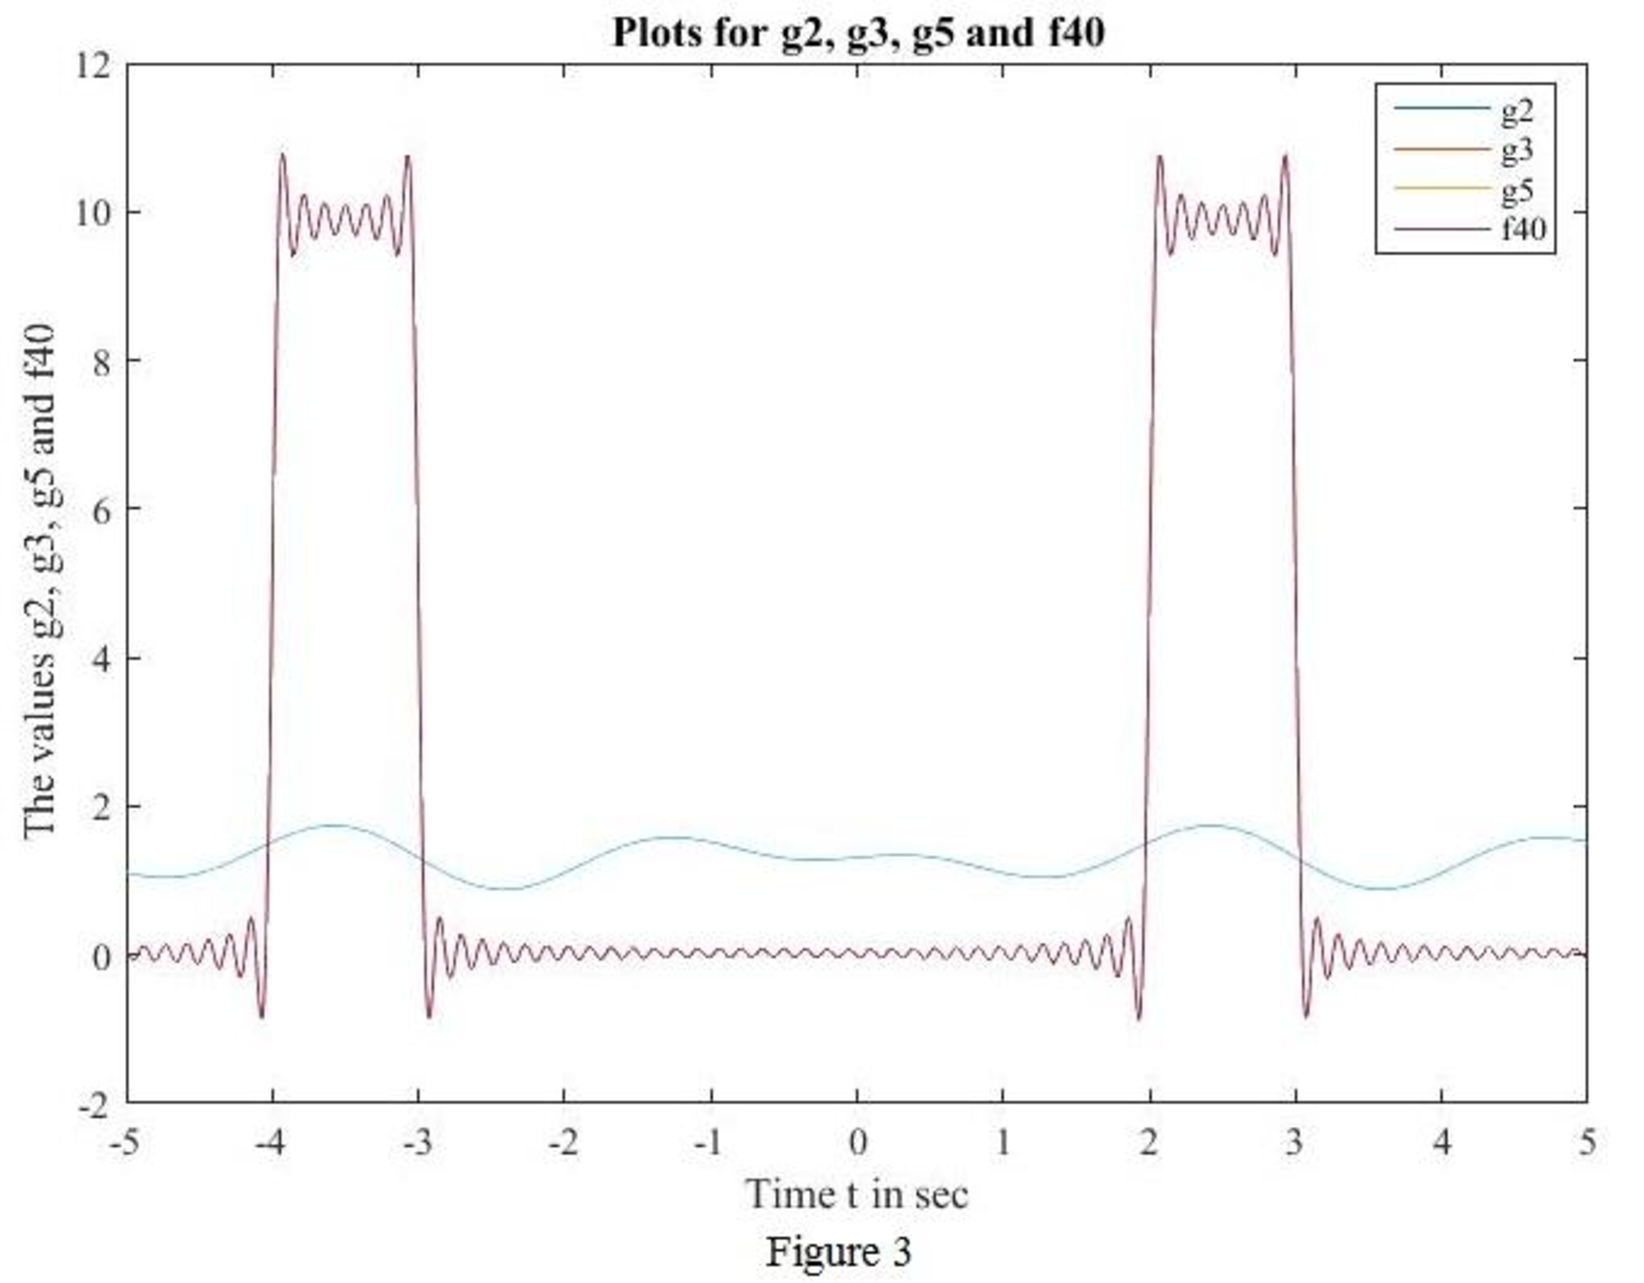
MATLAB code to sketch for
t=linspace(-5,5,1000); % vector for time over 1000 points.
T=6; % Period
w0=2*pi/T; % natural frequency, is w0=2*pi.
f0=1.667; % constant.
N=40; % consider N=40 for instant.
for i=1:1000;
g2=1.667-0.275*cos(3.141*t(i)/3)+0.159*sin(3.141*t(i)/3)+0.137*cos(2*3.141*t(i)/3)-0.238*sin(2*3.141*t(i)/3);
g3=1.667-0.275*cos(3.141*t(i)/3)+0.159*sin(3.141*t(i)/3)+0.137*cos(2*3.141*t(i)/3)-0.238*sin(2*3.141*t(i)/3)+0.212*sin(pi*t(i));
g5=1.667-0.275*cos(3.141*t(i)/3)+0.159*sin(3.141*t(i)/3)+0.137*cos(2*3.141*t(i)/3)-0.238*sin(2*3.141*t/3)+0.212*sin(pi*t)-0.069*cos(4*pi*t(i)/3)-0.119*sin(4*pi*t(i)/3)+0.055*cos(5*pi*t(i)/3)+0.0318*sin(5*pi*t(i)/3);
end
for i=1:1000;
sum=0;
for n=1:N;
sum=sum+(1/n*pi)*(sin(n*pi) -sin(2*n*pi/3))*cos(n*pi*t(i)/3) + (1/n*pi)*(cos(2*n*pi/3) -cos(n*pi))*sin(n*pi*t(i)/3);
end
f40(i)=f0+sum;
end
plot(t,g2,t,g3,t,g5,t,f40)
legend({'g2','g3','g5','f40'},'Location','best')
xlabel('Time t in sec')
ylabel('The values g2, g3, g5 and f40')
title('Plots for g2, g3, g5 and f40')
MATLAB output:
Conclusion:
Thus, the sketch for
(b)
Find the function
Answer to Problem 8E
The value of
Explanation of Solution
Given data:
Refer to Figure 17.30 in the textbook.
Calculation:
From Part (a), the function
Finding
From Part (a),
Finding
From Part (a),
Finding
From Part (a),
Finding
Conclusion:
Thus, the value of
Want to see more full solutions like this?
Chapter 17 Solutions
ENGINEERING CIRCUIT...(LL)>CUSTOM PKG.<
Additional Engineering Textbook Solutions
BASIC BIOMECHANICS
Database Concepts (8th Edition)
Electric Circuits. (11th Edition)
Concepts Of Programming Languages
Mechanics of Materials (10th Edition)
Thermodynamics: An Engineering Approach


- Add a second start button to the basic circuit so Start Button 1 or Start Button 2 can be used to start a motor. Include a second stop button that is connected so that Stop Button 1 or Start Button 2 can be used to stop the motor.arrow_forwardAdd a second start button to the basic circuit so Start Button 1 or Start Button 2 can be used to start a motor. Include a second stop button that is connected so that Stop Button 1 or Start Button 2 can be used to stop the motor.arrow_forwardCircuit Logic. Match each statement to the proper circuit. All circuits have been drawn with a light (L) to represent the load, whether it is a motor, bell, or any other kind of load. In addition, each switch is illustrated as a pushbutton whether it is a maintained switch, momentary switch, pushbutton, switch-on target, or any other type of switch. from electrical motor controls for integrated systems workbook 2014 chapter 5arrow_forward
- Ideal op-amps. R)1= 16 kΩ and R)2= 56 kΩ. Find the voltage gain v_o/v_i of the circuit.arrow_forwardR is 12 kΩ . Find the Thevenin equivalent resistance.arrow_forwardAssuming an ideal op-amp, design an inverting amplifier with a gain of 25 dB having the largest possible input resistance under the constraint of having to use resistors no larger than 90 kΩ. What's the input resist?arrow_forward
- I need help with this problem and an explanation of the solution for the image described below. (Introduction to Signals and Systems)arrow_forwardI hope the solution is on paper and not artificial intelligence. The subject is control systemarrow_forwardI hope the solution is on paper and not artificial intelligence.arrow_forward
 Introductory Circuit Analysis (13th Edition)Electrical EngineeringISBN:9780133923605Author:Robert L. BoylestadPublisher:PEARSON
 Delmar's Standard Textbook Of ElectricityElectrical EngineeringISBN:9781337900348Author:Stephen L. HermanPublisher:Cengage Learning
 Programmable Logic ControllersElectrical EngineeringISBN:9780073373843Author:Frank D. PetruzellaPublisher:McGraw-Hill Education
 Fundamentals of Electric CircuitsElectrical EngineeringISBN:9780078028229Author:Charles K Alexander, Matthew SadikuPublisher:McGraw-Hill Education
 Electric Circuits. (11th Edition)Electrical EngineeringISBN:9780134746968Author:James W. Nilsson, Susan RiedelPublisher:PEARSON
 Engineering ElectromagneticsElectrical EngineeringISBN:9780078028151Author:Hayt, William H. (william Hart), Jr, BUCK, John A.Publisher:Mcgraw-hill Education,