Videos
a
To make a table showing the relation between body and water weight for people weighing 100, 105, 110,120,125 and 130 pounds.
a
Explanation of Solution
Given:
The given relation is
Where w = weight of water in pounds.
b = body weight in pounds.
Calculation:
When the body weight ( b) =100 pounds, weight of water ( w ) is =
Similarly,
| Values of ‘b’ | Values of ‘w’ |
| 100 | |
| 105 | |
| 110 | |
| 120 | |
| 125 | |
| 130 |
Conclusion:
The above table shows the relation between body and water weight for people.
b
To identify the dependent and independent variables from the given relation.
b
Answer to Problem 37PPS
Weight of body is independent variable.
Weight of water is dependent variable.
Explanation of Solution
Given:
The given relation is
Independent variables are those variables which keeps on changing and they are unaffected by the change of any other parameter. For example: - Time.
Hence, Weight of the body ( b) is the deciding parameter which does not depend on other variable. So it is the independent variable.
Weight of the water ( w) depends on weight of the body ( b) as per the given relation.
So, the Weight of the water is the dependent variable.
Conclusion:
Therefore, weight of body is independent variable and weight of water is dependent variable.
c
To write: the domain and range of the relation
c
Answer to Problem 37PPS
Domain
Range
Explanation of Solution
Given:
The relation is
Domain is all the values of x - axis that is defined in the given relation.
Range is all the values of y - axis that are possible for corresponding values of x - axis.
Hence, for the relation
Calculation for graph:
Consider
| Values of ‘b’ | Values of ‘w’ |
| 100 | |
| 105 | |
| 110 | |
| 120 | |
| 125 | |
| 130 |
By taking different values of b , the graph can be plotted.
Graph:
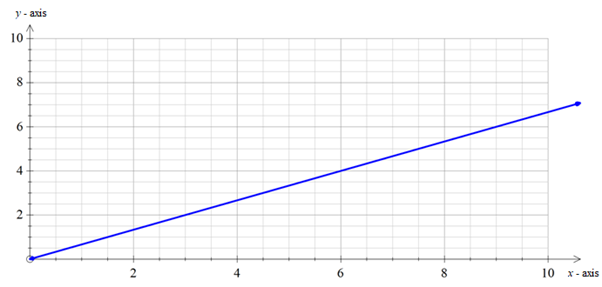
Interpretation:
From the above graph, it is clear that,
As the weight of the body increases, the weight of the water also increases.
d
To reverse the independent and dependent variable of the given relation, graph it and interpret the meaning of the graph.
d
Explanation of Solution
Given:
The relation is
Here, Weight of the body ( b ) is the independent variable.
Weight of water ( w) is the dependent variable
The given relation after reversing the independent and dependent variable is
This means, for every 3 pounds of water, there will be 2 pounds of body weight for an adult.
Calculation for graph:
Consider
| Values of ‘w’ | Values of ‘b’ |
| 100 | |
| 105 | |
| 110 | |
| 120 | |
| 125 | |
| 130 |
Graph:
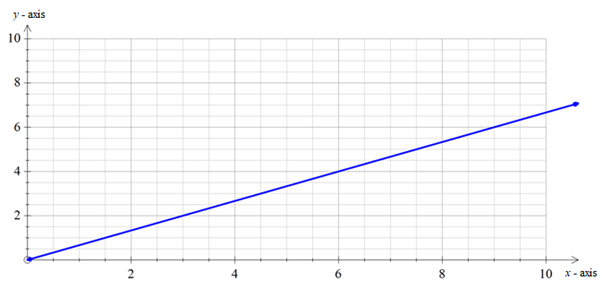
In the above graph, x - axis denotes the weight of the water ( w) in pounds.
y - axis denotes the weight of the body ( b ) in pounds.
Interpretation:
From the above graph, it is clear that,
As the weight of the water increases, the weight of the body also increases.
Chapter 1 Solutions
Algebra 1, Homework Practice Workbook (MERRILL ALGEBRA 1)
Additional Math Textbook Solutions
Elementary Statistics (13th Edition)
Pre-Algebra Student Edition
Elementary Statistics: Picturing the World (7th Edition)
College Algebra with Modeling & Visualization (5th Edition)
Basic Business Statistics, Student Value Edition
A Problem Solving Approach To Mathematics For Elementary School Teachers (13th Edition)


- The Course Name Real Analysis please Solve questions by Real Analysisarrow_forwardpart 3 of the question is: A power outage occurs 6 min after the ride started. Passengers must wait for their cage to be manually cranked into the lowest position in order to exit the ride. Sine function model: where h is the height of the last passenger above the ground measured in feet and t is the time of operation of the ride in minutes. What is the height of the last passenger at the moment of the power outage? Verify your answer by evaluating the sine function model. Will the last passenger to board the ride need to wait in order to exit the ride? Explain.arrow_forward2. The duration of the ride is 15 min. (a) How many times does the last passenger who boarded the ride make a complete loop on the Ferris wheel? (b) What is the position of that passenger when the ride ends?arrow_forward
- 3. A scientist recorded the movement of a pendulum for 10 s. The scientist began recording when the pendulum was at its resting position. The pendulum then moved right (positive displacement) and left (negative displacement) several times. The pendulum took 4 s to swing to the right and the left and then return to its resting position. The pendulum's furthest distance to either side was 6 in. Graph the function that represents the pendulum's displacement as a function of time. Answer: f(t) (a) Write an equation to represent the displacement of the pendulum as a function of time. (b) Graph the function. 10 9 8 7 6 5 4 3 2 1 0 t 1 2 3 4 5 6 7 8 9 10 11 12 13 14 15 -1 -5. -6 -7 -8 -9 -10-arrow_forwardA power outage occurs 6 min after the ride started. Passengers must wait for their cage to be manually cranked into the lowest position in order to exit the ride. Sine function model: h = −82.5 cos (3πt) + 97.5 where h is the height of the last passenger above the ground measured in feet and t is the time of operation of the ride in minutes. (a) What is the height of the last passenger at the moment of the power outage? Verify your answer by evaluating the sine function model. (b) Will the last passenger to board the ride need to wait in order to exit the ride? Explain.arrow_forwardThe Colossus Ferris wheel debuted at the 1984 New Orleans World's Fair. The ride is 180 ft tall, and passengers board the ride at an initial height of 15 ft above the ground. The height above ground, h, of a passenger on the ride is a periodic function of time, t. The graph displays the height above ground of the last passenger to board over the course of the 15 min ride. Height of Passenger in Ferris Wheel 180 160 140- €120 Height, h (ft) 100 80 60 40 20 0 ך 1 2 3 4 5 6 7 8 9 10 11 12 13 14 15 Time of operation, t (min) Sine function model: h = −82.5 cos (3πt) + 97.5 where h is the height of the passenger above the ground measured in feet and t is the time of operation of the ride in minutes. What is the period of the sine function model? Interpret the period you found in the context of the operation of the Ferris wheel. Answer:arrow_forward
- 1. Graph the function f(x)=sin(x) −2¸ Answer: y -2π 一元 1 −1 -2 -3 -4+ 元 2πarrow_forward3. Graph the function f(x) = −(x-2)²+4 Answer: f(x) 6 5 4 3 2+ 1 -6-5 -4-3-2-1 × 1 2 3 4 5 6 -1 -2+ ရာ -3+ -4+ -5 -6arrow_forward2. Graph the function f(x) = cos(2x)+1 Answer: -2π 一元 y 3 2- 1 -1 -2+ ရာ -3- Π 2πarrow_forward
- 2. Graph the function f(x) = |x+1+2 Answer: -6-5-4-3-2-1 f(x) 6 5 4 3 2 1 1 2 3 4 5 6 -1 -2 -3 -4 -5 -6arrow_forward1. The table shows values of a function f(x). What is the average rate of change of f(x) over the interval from x = 5 to x = 9? Show your work. X 4 f(x) LO 5 6 7 8 9 10 -2 8 10 11 14 18arrow_forward• Find a real-world situation that can be represented by a sinusoidal function. You may find something online that represents a sinusoidal graph or you can create a sinusoidal graph yourself with a measuring tape and a rope. • Provide a graph complete with labels and units for the x- and y-axes. • Describe the amplitude, period, and vertical shift in terms of the real-world situation.arrow_forward
 Algebra and Trigonometry (6th Edition)AlgebraISBN:9780134463216Author:Robert F. BlitzerPublisher:PEARSON
 Contemporary Abstract AlgebraAlgebraISBN:9781305657960Author:Joseph GallianPublisher:Cengage Learning
 Linear Algebra: A Modern IntroductionAlgebraISBN:9781285463247Author:David PoolePublisher:Cengage Learning
 Algebra And Trigonometry (11th Edition)AlgebraISBN:9780135163078Author:Michael SullivanPublisher:PEARSON
 Introduction to Linear Algebra, Fifth EditionAlgebraISBN:9780980232776Author:Gilbert StrangPublisher:Wellesley-Cambridge Press
 College Algebra (Collegiate Math)AlgebraISBN:9780077836344Author:Julie Miller, Donna GerkenPublisher:McGraw-Hill Education