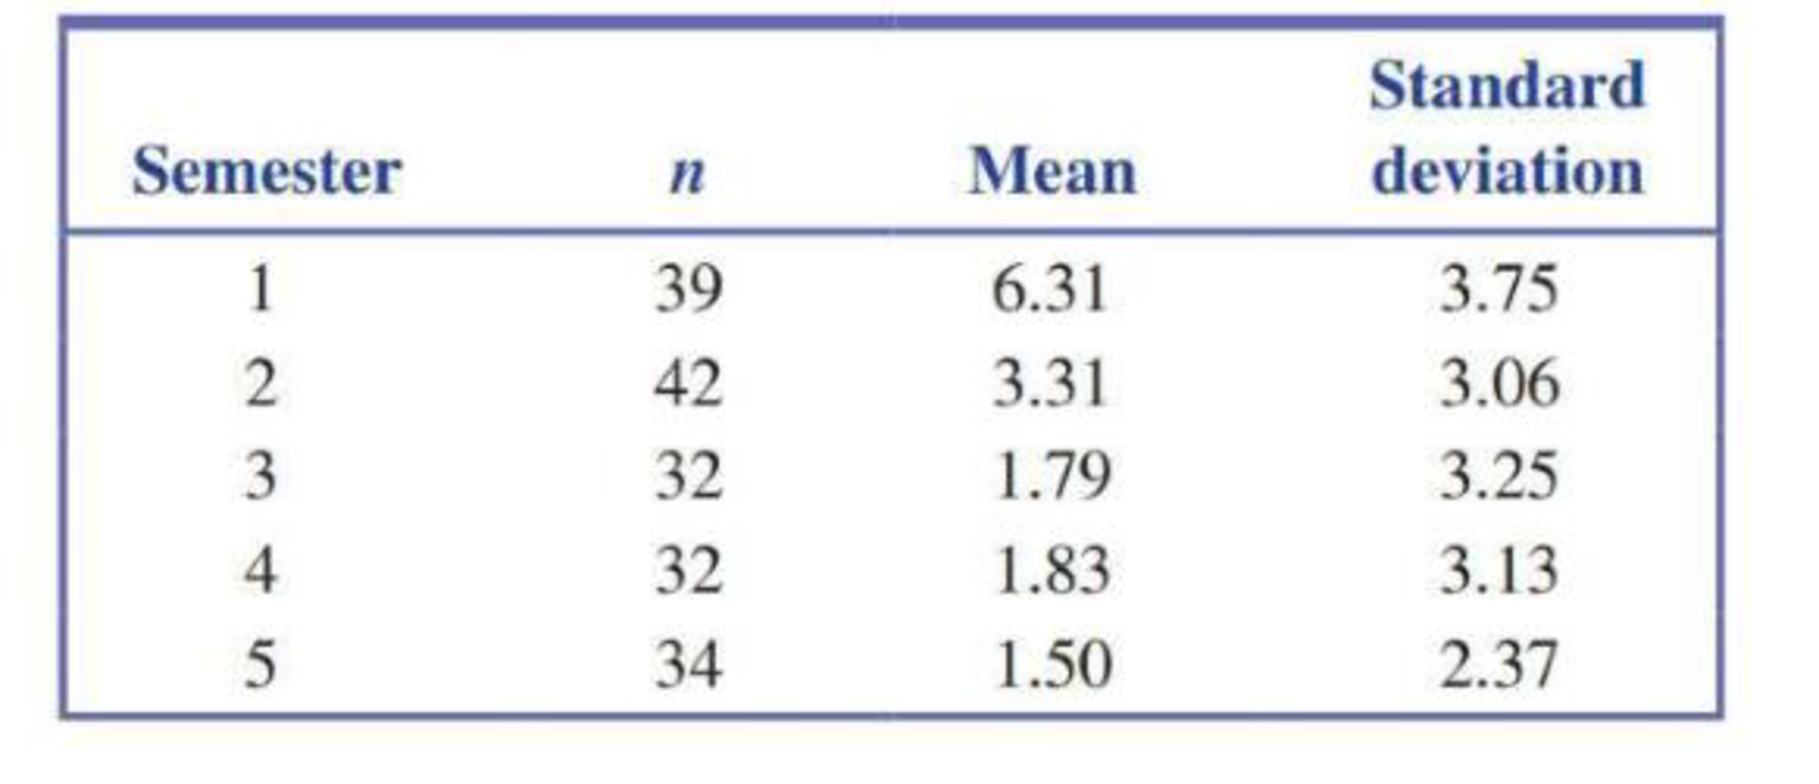
Can use of an online plagiarism-detection system reduce plagiarism in student research papers? The paper “Plagiarism and Technology: A Tool for Coping with Plagiarism” (Journal of Education for Business [2005]: 149–152) describes a study in which randomly selected research papers submitted by students during five semesters were analyzed for plagiarism. For each paper, the percentage of plagiarized words in the paper was determined by an online analysis. In each of the five semesters, students were told during the first two class meetings that they would have to submit an electronic version of their research papers and that the papers would be reviewed for plagiarism. Suppose that the number of papers sampled in each of the five semesters and the means and standard deviations for percentage of plagiarized words are as given in the accompanying table.
For purposes of this exercise, assume that the conditions necessary for the ANOVA F test are reasonable. Do these data provide evidence to support the claim that mean percentage of plagiarized words is not the same for all five semesters? Test the appropriate hypotheses using α = 0.05.

Check whether the data provides convincing evidence that the mean percentage of plagiarized words is not same for all five semesters with relevant hypothesis test at 0.05 level of significance.
Answer to Problem 8E
There is a convincing evidence that the mean ratings are not equal for all four label populations at 0.01 level of significance.
Explanation of Solution
Calculation:
The mean and standard deviation for percentage of plagiarized word and the number of papers sampled in each of the five semesters is given in the table.
Step 1:
Assume that
Step 2:
Null hypothesis:
Hence, the mean percentages of plagiarized words are same for five semesters.
Step 3:
Alternative hypothesis:
Hence, the mean percentages of plagiarized words are not same for five semesters.
Step 4:
Significance level:
Step 5:
Test statistic:
Here, MSTr is the mean sum of squares for treatment and MSE is the mean sum of squares for errors.
Step 6:
Assumptions:
It is given to assume that the conditions necessary for the ANOVA F test are reasonable.
Step 7:
Calculation:
The total number of observations is calculated as follows:
The grand mean is calculated as follows:
The value of sum of squares for treatments is calculated as follows:
The value of sum of squares for errors is calculated as follows:
The degrees of freedom for treatments is calculated as follows:
The degrees of freedom for errors is calculated as follows:
The value of mean sum of squares for treatments is calculated as follows:
The value of mean sum of squares for errors is calculated as follows:
The value of F test statistic is calculated as follows:
Step 8:
P-value:
Software procedure:
A step-by-step procedure to find P-value using MINITAB software is as follows:
- Choose Graph > Probability Distribution Plot, choose View Probability > OK.
- From Distribution, choose ‘F’ distribution.
- Enter the Numerator df as 4 and Denominator df as 174.
- Click the Shaded Area tab.
- Choose X Value and Right Tail for the region of the curve to shade.
- Enter the X value as 14.975.
- Click OK.
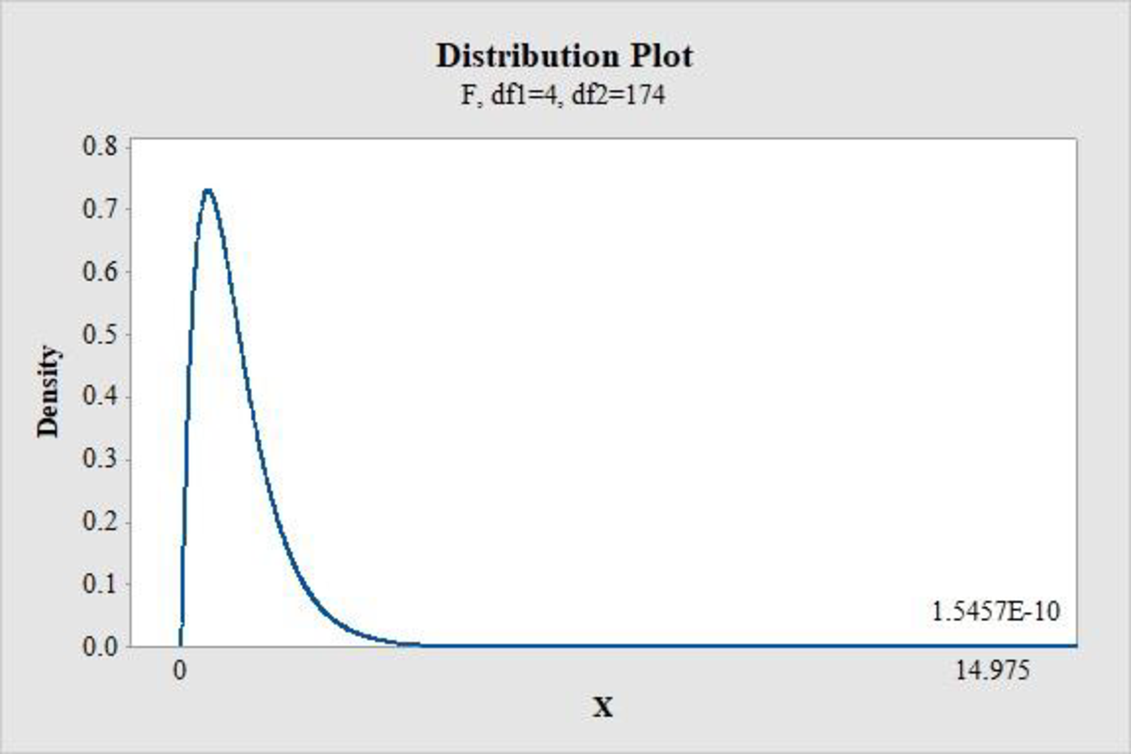
Output obtained using MINITAB software is as follows:

From MINITAB output, the P-value is 0.000.
Step 9:
Decision rule:
If
Conclusion:
Here,
Since, P-value of 0 is less than the 0.05 level of significance.
Hence, reject the null hypothesis.
Thus, it can be concluded that there is a convincing evidence that the mean percentage of plagiarized words are not equal for five semesters.
Want to see more full solutions like this?
Chapter 15 Solutions
Bundle: Introduction to Statistics and Data Analysis, 5th + WebAssign Printed Access Card: Peck/Olsen/Devore. 5th Edition, Single-Term
 Glencoe Algebra 1, Student Edition, 9780079039897...AlgebraISBN:9780079039897Author:CarterPublisher:McGraw Hill
 College Algebra (MindTap Course List)AlgebraISBN:9781305652231Author:R. David Gustafson, Jeff HughesPublisher:Cengage Learning
 Big Ideas Math A Bridge To Success Algebra 1: Stu...AlgebraISBN:9781680331141Author:HOUGHTON MIFFLIN HARCOURTPublisher:Houghton Mifflin Harcourt
 Holt Mcdougal Larson Pre-algebra: Student Edition...AlgebraISBN:9780547587776Author:HOLT MCDOUGALPublisher:HOLT MCDOUGAL


