
Excursions In Modern Mathematics, 9th Edition
9th Edition
ISBN: 9780134494142
Author: Tannenbaum
Publisher: PEARSON
expand_more
expand_more
format_list_bulleted
Concept explainers
Videos
Textbook Question
Chapter 15, Problem 45E
Exercises 45 and 46 refer to the two box plots in Fig. 15-18 showing the starting salaries of Tasmania State University first-year graduates in agriculture and engineering. (These are the two box plots discussed in Example 15.15.)
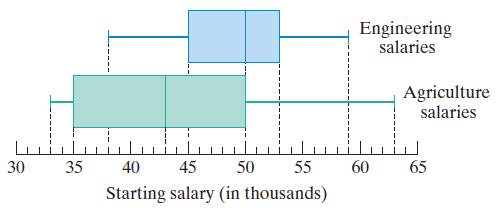
Figure 15-18
a. What is the median salary for agriculture major?
b. What is the median salary for engineering major?
c. Explain how can we tell that the median salary for engineering majors is same as the third quartile salary for agriculture majors.
Expert Solution & Answer
Want to see the full answer?
Check out a sample textbook solution
Students have asked these similar questions
Calculs Insights
πT
| cos x |³ dx
59
2
2. Consider the ODE
u' = ƒ (u) = u² + r
where r is a parameter that can take the values r = −1, −0.5, -0.1, 0.1. For each value of r:
(a) Sketch ƒ(u) = u² + r and determine the equilibrium points.
(b) Draw the phase line.
(d) Determine the stability of the equilibrium points.
(d) Plot the direction field and some sample solutions,i.e., u(t)
(e) Describe how location of the equilibrium points and their stability change as you increase the
parameter r.
(f) Using the matlab program phaseline.m generate a solution for each value of r and the initial
condition u(0) = 0.9. Print and turn in your result for r = −1. Do not forget to add a figure caption.
(g) In the matlab program phaseline.m set the initial condition to u(0) = 1.1 and simulate the ode
over the time interval t = [0, 10] for different values of r. What happens? Why? You do not need to
turn in a plot for (g), just describe what happens.
The following are suggested designs for group sequential studies. Using PROCSEQDESIGN, provide the following for the design O’Brien Fleming and Pocock.• The critical boundary values for each analysis of the data• The expected sample sizes at each interim analysisAssume the standardized Z score method for calculating boundaries.Investigators are evaluating the success rate of a novel drug for treating a certain type ofbacterial wound infection. Since no existing treatment exists, they have planned a one-armstudy. They wish to test whether the success rate of the drug is better than 50%, whichthey have defined as the null success rate. Preliminary testing has estimated the successrate of the drug at 55%. The investigators are eager to get the drug into production andwould like to plan for 9 interim analyses (10 analyzes in total) of the data. Assume thesignificance level is 5% and power is 90%.Besides, draw a combined boundary plot (OBF, POC, and HP)
Chapter 15 Solutions
Excursions In Modern Mathematics, 9th Edition
Ch. 15 - Exercises 1 through 4 refer to the data set shown...Ch. 15 - Exercises 1 through 4 refer to the data set shown...Ch. 15 - Exercises 1 through 4 refer to the data set shown...Ch. 15 - Exercises 1 through 4 refer to the data set shown...Ch. 15 - Exercises 5 through 10 refer to Table 15-13, which...Ch. 15 - Exercises 5 through 10 refer to Table 15-13, which...Ch. 15 - Exercises 5 through 10 refer to Table 15-13, which...Ch. 15 - Exercise 5 through 10 refer to Table 15-13, which...Ch. 15 - Exercise 5 through 10 refer to Table 15-13, which...Ch. 15 - Exercise 5 through 10 refer to Table 15-13, which...
Ch. 15 - Exercise 11 and 12 refer to the bar graph shown in...Ch. 15 - Exercise 11 and 12 refer to the bar graph shown in...Ch. 15 - Exercise 13 and 14 refer to the pie chart in Fig....Ch. 15 - Exercise 13 and 14 refer to the pie chart in Fig....Ch. 15 - Table 15-14 shows the class interval frequencies...Ch. 15 - Table 15-15 shows the class interval frequencies...Ch. 15 - Table 15-16 shows the percentage of U.S. working...Ch. 15 - Table 15-17 shows the percentage of U.S. workers...Ch. 15 - Exercises 19 and 20 refer to Table 15-18, which...Ch. 15 - More than Less than or equal to Number of babies...Ch. 15 - Exercises 21 and 22 refer to the two histograms...Ch. 15 - Exercises 21 and 22 refer to the two histograms...Ch. 15 - Consider the data set {3,5,7,4,8,2,8,3,6}. a.Find...Ch. 15 - Consider the data set {4,6,8,5.2,10.4,10,12.6,13}...Ch. 15 - Find the average A and median M of each of the...Ch. 15 - Find the average A and median M of each of the...Ch. 15 - Find the average A and median M of each of the...Ch. 15 - Find the average A and median M of each of the...Ch. 15 - Table 15-19 shows the results of a 5-point musical...Ch. 15 - Table 15-20 shows the ages of the firefighters in...Ch. 15 - Table 15-21 shows the relative frequencies of the...Ch. 15 - Table 15-22 shows the relative frequencies of the...Ch. 15 - Consider the data set {5,7,4,8,2,8,3,6}. a. Find...Ch. 15 - Consider the data set {4,6,8,5.2,10.4,10,12.6,13}....Ch. 15 - For each data set, find the 75th and the 90th...Ch. 15 - For each data set, find the 10th and the 25th...Ch. 15 - Table 15-20 Age 25 27 28 29 30 Frequency 2 7 6 9...Ch. 15 - This exercise refers to the math quiz scores shown...Ch. 15 - Prob. 39ECh. 15 - Exercise 39 and 40 refer to SAT test scores for...Ch. 15 - Consider the data set {5,7,4,8,2,8,3,6}. a. Find...Ch. 15 - Consider the data set {4,6,8,5.2,10.4,10,12.6,13}....Ch. 15 - Prob. 43ECh. 15 - This exercise refers to the distribution of the...Ch. 15 - Exercises 45 and 46 refer to the two box plots in...Ch. 15 - Exercises 45 and 46 refer to the two box plots in...Ch. 15 - For the data set {5,7,4,8,2,8,3,6}, find a. the...Ch. 15 - For the data set {4,6,8,5.2,10.4,10,12.6,13}, find...Ch. 15 - A realty company has sold N=341 homes in the last...Ch. 15 - Exercise 45 and 46 refer to the box plot in...Ch. 15 - Prob. 51ECh. 15 - For Exercises 51 through 54, you should use the...Ch. 15 - For Exercises 51 through 54, you should use the...Ch. 15 - For Exercises 51 through 54, you should use the...Ch. 15 - The purpose of Exercises 55 and 56 is to practice...Ch. 15 - The purpose of Exercises 55 and 56 is to practice...Ch. 15 - Exercises 57 and 58 refer to the mode of a data...Ch. 15 - Exercises 57 and 58 refer to the mode of a data...Ch. 15 - Mikes average on the first five exams in Econ 1A...Ch. 15 - Explain each of the following statements regarding...Ch. 15 - In 2006, the median SAT score was the average of...Ch. 15 - In 2004, the third quartile SAT scores was...Ch. 15 - Prob. 63ECh. 15 - Suppose that the average of 10 numbers is 7.5 and...Ch. 15 - Prob. 65ECh. 15 - What happens to the five-number summary of the...Ch. 15 - Prob. 67ECh. 15 - Prob. 68ECh. 15 - Prob. 69ECh. 15 - Prob. 70ECh. 15 - Prob. 71ECh. 15 - Prob. 72ECh. 15 - Prob. 73ECh. 15 - Suppose that the standard deviation of the data...Ch. 15 - Chebyshevs theorem. The Russian mathematician P.L....
Knowledge Booster


Learn more about
Need a deep-dive on the concept behind this application? Look no further. Learn more about this topic, subject and related others by exploring similar questions and additional content below.Similar questions
- 4. Solve the system of equations and express your solution using vectors. 2x1 +5x2+x3 + 3x4 = 9 -x2+x3 + x4 = 1 -x1-6x2+3x3 + 2x4 = -1arrow_forward3. Simplify the matrix expression A(A-B) - (A+B)B-2(A - B)2 + (A + B) 2arrow_forward[2 pts] 1. Let A = [. 1 -1 0 -343 and B = 05 5 -7 304 Compute (7A - 3B) - 4(2A - B).arrow_forward
- 20 2. Let A = = [ -2 0 1 3 ] and B = 2 3 -1 2 For each of the following, calculate the product or indicate why it is undefined: (a) AB (b) BAarrow_forwardTrue or False and whyarrow_forward10 5 Obtain by multiplying matrices the composite coordinate transformation of two transformations, first x' = (x + y√√2+2)/2 y' = z' (x√√2-2√2)/2 z = (-x+y√√2-2)/2 followed by x" = (x'√√2+z'√√2)/2 y" = (-x'y'√√2+2')/2 z" = (x'y'√√2-2')/2.arrow_forward
- Not use ai pleasearrow_forward4 The plane 2x+3y+ 6z = 6 intersects the coordinate axes at P, Q, and R, forming a triangle. Draw a figure and identify the three points on it. Also find vectors PQ and PR. Write a vector formula for the area of the triangle PQR and find its value.arrow_forward3.1 Limits 1. If lim f(x)=-6 and lim f(x)=5, then lim f(x). Explain your choice. x+3° x+3* x+3 (a) Is 5 (c) Does not exist (b) is 6 (d) is infinitearrow_forward
- 1 pts Let F and G be vector fields such that ▼ × F(0, 0, 0) = (0.76, -9.78, 3.29), G(0, 0, 0) = (−3.99, 6.15, 2.94), and G is irrotational. Then sin(5V (F × G)) at (0, 0, 0) is Question 1 -0.246 0.072 -0.934 0.478 -0.914 -0.855 0.710 0.262 .arrow_forwardAnswer the number questions with the following answers +/- 2 sqrt(2) +/- i sqrt(6) (-3 +/-3 i sqrt(3))/4 +/-1 +/- sqrt(6) +/- 2/3 sqrt(3) 4 -3 +/- 3 i sqrt(3)arrow_forward2. Answer the following questions. (A) [50%] Given the vector field F(x, y, z) = (x²y, e", yz²), verify the differential identity Vx (VF) V(V •F) - V²F (B) [50%] Remark. You are confined to use the differential identities. Let u and v be scalar fields, and F be a vector field given by F = (Vu) x (Vv) (i) Show that F is solenoidal (or incompressible). (ii) Show that G = (uvv – vVu) is a vector potential for F.arrow_forward
arrow_back_ios
SEE MORE QUESTIONS
arrow_forward_ios
Recommended textbooks for you
 Holt Mcdougal Larson Pre-algebra: Student Edition...AlgebraISBN:9780547587776Author:HOLT MCDOUGALPublisher:HOLT MCDOUGAL
 Glencoe Algebra 1, Student Edition, 9780079039897...AlgebraISBN:9780079039897Author:CarterPublisher:McGraw Hill
 Big Ideas Math A Bridge To Success Algebra 1: Stu...AlgebraISBN:9781680331141Author:HOUGHTON MIFFLIN HARCOURTPublisher:Houghton Mifflin Harcourt
 Functions and Change: A Modeling Approach to Coll...AlgebraISBN:9781337111348Author:Bruce Crauder, Benny Evans, Alan NoellPublisher:Cengage Learning
Holt Mcdougal Larson Pre-algebra: Student Edition...
Algebra
ISBN:9780547587776
Author:HOLT MCDOUGAL
Publisher:HOLT MCDOUGAL
Glencoe Algebra 1, Student Edition, 9780079039897...
Algebra
ISBN:9780079039897
Author:Carter
Publisher:McGraw Hill
Big Ideas Math A Bridge To Success Algebra 1: Stu...
Algebra
ISBN:9781680331141
Author:HOUGHTON MIFFLIN HARCOURT
Publisher:Houghton Mifflin Harcourt
Functions and Change: A Modeling Approach to Coll...
Algebra
ISBN:9781337111348
Author:Bruce Crauder, Benny Evans, Alan Noell
Publisher:Cengage Learning
Correlation Vs Regression: Difference Between them with definition & Comparison Chart; Author: Key Differences;https://www.youtube.com/watch?v=Ou2QGSJVd0U;License: Standard YouTube License, CC-BY
Correlation and Regression: Concepts with Illustrative examples; Author: LEARN & APPLY : Lean and Six Sigma;https://www.youtube.com/watch?v=xTpHD5WLuoA;License: Standard YouTube License, CC-BY