
Concept explainers
Videos
Exercises 1 through 4 refer to the data set shown in Table 15-12. The table shows the scores on a Chem 103 test consisting of 10 questions worth 10 points each.
Chem 103 test scores.
Table 15-12
Chem 103 test scores
| Student ID | Score | Student ID | Score |
| 1362 | 50 | 4315 | 70 |
| 1486 | 70 | 4719 | 70 |
| 1721 | 80 | 4951 | 60 |
| 1932 | 60 | 5321 | 60 |
| 2489 | 70 | 5872 | 100 |
| 2766 | 10 | 6433 | 50 |
| 2877 | 80 | 6921 | 50 |
| 2964 | 60 | 8317 | 70 |
| 3217 | 70 | 8854 | 100 |
| 3588 | 80 | 8964 | 80 |
| 3780 | 80 | 9158 | 60 |
| 3921 | 60 | 9347 | 60 |
| 4107 | 40 |
a. Make a frequency table for the Chem 103 test scores.
b. Draw a bar graph for the data in Table 15-12.
a.
To find:
The frequency table for the Chem 103 test scores.
Answer to Problem 1E
Solution:
The frequency table for the Chem 103 test scores is given by,
| Score | Frequency |
| 10 | 1 |
| 40 | 1 |
| 50 | 3 |
| 60 | 7 |
| 70 | 6 |
| 80 | 5 |
| 100 | 2 |
Explanation of Solution
Given:
The table below shows the scores on a Chem 103 test consisting of 10 questions worth 10 points each.
| Student ID | Score | Student ID | Score |
| 1362 | 50 | 4315 | 70 |
| 1486 | 70 | 4719 | 70 |
| 1721 | 80 | 4951 | 60 |
| 1932 | 60 | 5321 | 60 |
| 2489 | 70 | 5872 | 100 |
| 2766 | 10 | 6433 | 50 |
| 2877 | 80 | 6921 | 50 |
| 2964 | 60 | 8317 | 70 |
| 3217 | 70 | 8854 | 100 |
| 3588 | 80 | 8964 | 80 |
| 3780 | 80 | 9158 | 60 |
| 3921 | 60 | 9347 | 60 |
| 4107 | 40 |
A frequency table is a table with the frequency of each actual value in the data set.
Approach:
From the given table the number of students with a score of 10 is 1, so the frequency of score 10 is 1, similarly the number of students with a score of 40 is 1, so the frequency of score 40 is 1 similarly frequencies for rest of scores can be computed.
The frequency table for the Chem 103 test is given by,
| Score | Frequency |
| 10 | 1 |
| 40 | 1 |
| 50 | 3 |
| 60 | 7 |
| 70 | 6 |
| 80 | 5 |
| 100 | 2 |
b)
To construct:
The bar graph corresponding to the given table.
Answer to Problem 1E
Solution:
The bar graph is given below.

Explanation of Solution
Given:
The table below shows the scores on a Chem 103 test consisting of 10 questions worth 10 points each.
| Student ID | Score | Student ID | Score |
| 1362 | 50 | 4315 | 70 |
| 1486 | 70 | 4719 | 70 |
| 1721 | 80 | 4951 | 60 |
| 1932 | 60 | 5321 | 60 |
| 2489 | 70 | 5872 | 100 |
| 2766 | 10 | 6433 | 50 |
| 2877 | 80 | 6921 | 50 |
| 2964 | 60 | 8317 | 70 |
| 3217 | 70 | 8854 | 100 |
| 3588 | 80 | 8964 | 80 |
| 3780 | 80 | 9158 | 60 |
| 3921 | 60 | 9347 | 60 |
| 4107 | 40 |
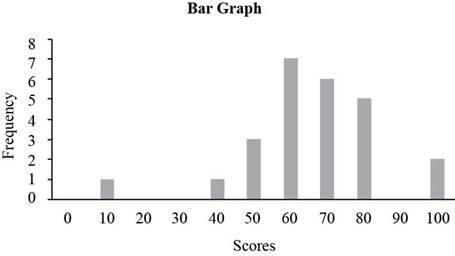
A bar graph is a graph with bars (column) representing each of the actual values in the data set. The height of each column represents the frequency of the value in the data set.
Approach:
From the given table the number of students with a score of 0 is 0, so the frequency of score 0 is 0, similarly the number of students with a score of 10 is 1, so the frequency of score 10 is 1 similarly frequencies for rest of scores can be computed.
The frequency table for the Chem 103 test is given by,
| Score | Frequency |
| 0 | 0 |
| 10 | 1 |
| 20 | 0 |
| 30 | 0 |
| 40 | 1 |
| 50 | 3 |
| 60 | 7 |
| 70 | 6 |
| 80 | 5 |
| 90 | 0 |
| 100 | 2 |
Place the scores along horizontal axis and the frequencies along vertical axis to construct bar graph. The bar graph of the frequency table is given below.
Want to see more full solutions like this?
Chapter 15 Solutions
Excursions In Modern Mathematics, 9th Edition
Additional Math Textbook Solutions
Pathways To Math Literacy (looseleaf)
Finite Mathematics for Business, Economics, Life Sciences and Social Sciences
Introductory Statistics
Elementary & Intermediate Algebra
Algebra and Trigonometry (6th Edition)
Calculus: Early Transcendentals (2nd Edition)


- 2.2, 13.2-13.3) question: 5 point(s) possible ubmit test The accompanying table contains the data for the amounts (in oz) in cans of a certain soda. The cans are labeled to indicate that the contents are 20 oz of soda. Use the sign test and 0.05 significance level to test the claim that cans of this soda are filled so that the median amount is 20 oz. If the median is not 20 oz, are consumers being cheated? Click the icon to view the data. What are the null and alternative hypotheses? OA. Ho: Medi More Info H₁: Medi OC. Ho: Medi H₁: Medi Volume (in ounces) 20.3 20.1 20.4 Find the test stat 20.1 20.5 20.1 20.1 19.9 20.1 Test statistic = 20.2 20.3 20.3 20.1 20.4 20.5 Find the P-value 19.7 20.2 20.4 20.1 20.2 20.2 P-value= (R 19.9 20.1 20.5 20.4 20.1 20.4 Determine the p 20.1 20.3 20.4 20.2 20.3 20.4 Since the P-valu 19.9 20.2 19.9 Print Done 20 oz 20 oz 20 oz 20 oz ce that the consumers are being cheated.arrow_forwardT Teenage obesity (O), and weekly fast-food meals (F), among some selected Mississippi teenagers are: Name Obesity (lbs) # of Fast-foods per week Josh 185 10 Karl 172 8 Terry 168 9 Kamie Andy 204 154 12 6 (a) Compute the variance of Obesity, s²o, and the variance of fast-food meals, s², of this data. [Must show full work]. (b) Compute the Correlation Coefficient between O and F. [Must show full work]. (c) Find the Coefficient of Determination between O and F. [Must show full work]. (d) Obtain the Regression equation of this data. [Must show full work]. (e) Interpret your answers in (b), (c), and (d). (Full explanations required). Edit View Insert Format Tools Tablearrow_forwardH.w WI M Wz dy A Sindax Sind ①dlmax У тах at 0.75m from A W=6KN/M L=2 W2 = 9 KN/m P= 10 KN Barrow_forward
- No chatgpt pls will upvotearrow_forwardQ4*) Find the extremals y, z of the the functional 1 = √² (2yz — 2z² + y² — z¹²) dx, - - with y(0) = 0, y(1) = 1, z(0) = 0, z(1) = 0.arrow_forwardlet h0, h1, h2,..., hn,....be the sequence defined by hn = (n C 2), (n choose 2). (n>=0). Determine the generating function for the sequence.arrow_forward
- Draw the triangle and show all the workarrow_forwardThe average miles per gallon for a sample of 40 cars of model SX last year was 32.1, with a population standard deviation of 3.8. A sample of 40 cars from this year’s model SX has an average of 35.2 mpg, with a population standard deviation of 5.4. Find a 99 percent confidence interval for the difference in average mpg for this car brand (this year’s model minus last year’s).Find a 99 percent confidence interval for the difference in average mpg for last year’s model minus this year’s. What does the negative difference mean?arrow_forwardA special interest group reports a tiny margin of error (plus or minus 0.04 percent) for its online survey based on 50,000 responses. Is the margin of error legitimate? (Assume that the group’s math is correct.)arrow_forward
- Suppose that 73 percent of a sample of 1,000 U.S. college students drive a used car as opposed to a new car or no car at all. Find an 80 percent confidence interval for the percentage of all U.S. college students who drive a used car.What sample size would cut this margin of error in half?arrow_forwardYou want to compare the average number of tines on the antlers of male deer in two nearby metro parks. A sample of 30 deer from the first park shows an average of 5 tines with a population standard deviation of 3. A sample of 35 deer from the second park shows an average of 6 tines with a population standard deviation of 3.2. Find a 95 percent confidence interval for the difference in average number of tines for all male deer in the two metro parks (second park minus first park).Do the parks’ deer populations differ in average size of deer antlers?arrow_forwardSuppose that you want to increase the confidence level of a particular confidence interval from 80 percent to 95 percent without changing the width of the confidence interval. Can you do it?arrow_forward
 Holt Mcdougal Larson Pre-algebra: Student Edition...AlgebraISBN:9780547587776Author:HOLT MCDOUGALPublisher:HOLT MCDOUGAL
 Glencoe Algebra 1, Student Edition, 9780079039897...AlgebraISBN:9780079039897Author:CarterPublisher:McGraw Hill
 Functions and Change: A Modeling Approach to Coll...AlgebraISBN:9781337111348Author:Bruce Crauder, Benny Evans, Alan NoellPublisher:Cengage Learning
 Big Ideas Math A Bridge To Success Algebra 1: Stu...AlgebraISBN:9781680331141Author:HOUGHTON MIFFLIN HARCOURTPublisher:Houghton Mifflin Harcourt