
Excursions In Modern Mathematics, 9th Edition
9th Edition
ISBN: 9780134494142
Author: Tannenbaum
Publisher: PEARSON
expand_more
expand_more
format_list_bulleted
Concept explainers
Videos
Textbook Question
Chapter 15, Problem 13E
Exercise 13 and 14 refer to the pie chart in Fig. 15-16.
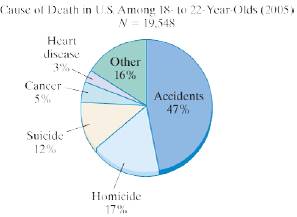
Figure 15-16
Source: Centers for Disease Control and Prevention, www.cdc.gov.
a. Is cause of death a quantitative or qualitative variable?
b. Use the data provided in the pie chart to estimate the number of 18- to 22-year-olds who died in the United States in 2005 due to an accident.
Expert Solution & Answer
Want to see the full answer?
Check out a sample textbook solution
Students have asked these similar questions
1. Name the ongiewing)
2. Name five pairs of supple
3 27 and 19 form a
angles
210 and 21 are complementary angies
4. m210=32 mal!=
5 mc11-72 m10=
6 m210-4x mc11=2x x=
7 m210=x m 11 =x+20; x=
12 and 213 are supplementary angles
8 ma 12 2y m13-3y-15 y=
9 m 12-y+10 m13-3y+ 10: y=
10. The measure of 212 is five times the measure of 13. Find the
213 and 214 are complementary angles, and
14 and 15 are supplementary angies
11 mc13 47 m/14-
12 m 14-78 m13-
m215-
m15
13 m15-135 m. 13-
m.14
3. Solve the inequality, and give your answer in interval notation.
-
(x − 4)³ (x + 1) ≥ 0
1. Find the formula to the polynomial at right.
Show all your work. (4 points)
1-
2
3
сл
5
6
-4
-3
-2
-1
0
2
3
Chapter 15 Solutions
Excursions In Modern Mathematics, 9th Edition
Ch. 15 - Exercises 1 through 4 refer to the data set shown...Ch. 15 - Exercises 1 through 4 refer to the data set shown...Ch. 15 - Exercises 1 through 4 refer to the data set shown...Ch. 15 - Exercises 1 through 4 refer to the data set shown...Ch. 15 - Exercises 5 through 10 refer to Table 15-13, which...Ch. 15 - Exercises 5 through 10 refer to Table 15-13, which...Ch. 15 - Exercises 5 through 10 refer to Table 15-13, which...Ch. 15 - Exercise 5 through 10 refer to Table 15-13, which...Ch. 15 - Exercise 5 through 10 refer to Table 15-13, which...Ch. 15 - Exercise 5 through 10 refer to Table 15-13, which...
Ch. 15 - Exercise 11 and 12 refer to the bar graph shown in...Ch. 15 - Exercise 11 and 12 refer to the bar graph shown in...Ch. 15 - Exercise 13 and 14 refer to the pie chart in Fig....Ch. 15 - Exercise 13 and 14 refer to the pie chart in Fig....Ch. 15 - Table 15-14 shows the class interval frequencies...Ch. 15 - Table 15-15 shows the class interval frequencies...Ch. 15 - Table 15-16 shows the percentage of U.S. working...Ch. 15 - Table 15-17 shows the percentage of U.S. workers...Ch. 15 - Exercises 19 and 20 refer to Table 15-18, which...Ch. 15 - More than Less than or equal to Number of babies...Ch. 15 - Exercises 21 and 22 refer to the two histograms...Ch. 15 - Exercises 21 and 22 refer to the two histograms...Ch. 15 - Consider the data set {3,5,7,4,8,2,8,3,6}. a.Find...Ch. 15 - Consider the data set {4,6,8,5.2,10.4,10,12.6,13}...Ch. 15 - Find the average A and median M of each of the...Ch. 15 - Find the average A and median M of each of the...Ch. 15 - Find the average A and median M of each of the...Ch. 15 - Find the average A and median M of each of the...Ch. 15 - Table 15-19 shows the results of a 5-point musical...Ch. 15 - Table 15-20 shows the ages of the firefighters in...Ch. 15 - Table 15-21 shows the relative frequencies of the...Ch. 15 - Table 15-22 shows the relative frequencies of the...Ch. 15 - Consider the data set {5,7,4,8,2,8,3,6}. a. Find...Ch. 15 - Consider the data set {4,6,8,5.2,10.4,10,12.6,13}....Ch. 15 - For each data set, find the 75th and the 90th...Ch. 15 - For each data set, find the 10th and the 25th...Ch. 15 - Table 15-20 Age 25 27 28 29 30 Frequency 2 7 6 9...Ch. 15 - This exercise refers to the math quiz scores shown...Ch. 15 - Prob. 39ECh. 15 - Exercise 39 and 40 refer to SAT test scores for...Ch. 15 - Consider the data set {5,7,4,8,2,8,3,6}. a. Find...Ch. 15 - Consider the data set {4,6,8,5.2,10.4,10,12.6,13}....Ch. 15 - Prob. 43ECh. 15 - This exercise refers to the distribution of the...Ch. 15 - Exercises 45 and 46 refer to the two box plots in...Ch. 15 - Exercises 45 and 46 refer to the two box plots in...Ch. 15 - For the data set {5,7,4,8,2,8,3,6}, find a. the...Ch. 15 - For the data set {4,6,8,5.2,10.4,10,12.6,13}, find...Ch. 15 - A realty company has sold N=341 homes in the last...Ch. 15 - Exercise 45 and 46 refer to the box plot in...Ch. 15 - Prob. 51ECh. 15 - For Exercises 51 through 54, you should use the...Ch. 15 - For Exercises 51 through 54, you should use the...Ch. 15 - For Exercises 51 through 54, you should use the...Ch. 15 - The purpose of Exercises 55 and 56 is to practice...Ch. 15 - The purpose of Exercises 55 and 56 is to practice...Ch. 15 - Exercises 57 and 58 refer to the mode of a data...Ch. 15 - Exercises 57 and 58 refer to the mode of a data...Ch. 15 - Mikes average on the first five exams in Econ 1A...Ch. 15 - Explain each of the following statements regarding...Ch. 15 - In 2006, the median SAT score was the average of...Ch. 15 - In 2004, the third quartile SAT scores was...Ch. 15 - Prob. 63ECh. 15 - Suppose that the average of 10 numbers is 7.5 and...Ch. 15 - Prob. 65ECh. 15 - What happens to the five-number summary of the...Ch. 15 - Prob. 67ECh. 15 - Prob. 68ECh. 15 - Prob. 69ECh. 15 - Prob. 70ECh. 15 - Prob. 71ECh. 15 - Prob. 72ECh. 15 - Prob. 73ECh. 15 - Suppose that the standard deviation of the data...Ch. 15 - Chebyshevs theorem. The Russian mathematician P.L....
Knowledge Booster


Learn more about
Need a deep-dive on the concept behind this application? Look no further. Learn more about this topic, subject and related others by exploring similar questions and additional content below.Similar questions
- 2. Find the leading term (2 points): f(x) = −3x(2x − 1)²(x+3)³ -arrow_forward1- √ √ √³ e³/√xdy dx 1 cy² 2- √ √² 3 y³ exy dx dy So 3- √ √sinx y dy dx 4- Jo √² Sy² dx dyarrow_forwardA building that is 205 feet tall casts a shadow of various lengths æ as the day goes by. An angle of elevation is formed by lines from the top and bottom of the building to the tip of the shadow, as de seen in the following figure. Find the rate of change of the angle of elevation when x 278 feet. dx Round to 3 decimal places. Γ X radians per footarrow_forward
- Find The partial fraction decomposition for each The following 2× B) (x+3) a 3 6 X-3x+2x-6arrow_forward1) Find the partial feraction decomposition for each of 5- X 2 2x+x-1 The following: 3 B) 3 X + 3xarrow_forwardUse the information in the following table to find h' (a) at the given value for a. x|f(x) g(x) f'(x) g(x) 0 0 0 4 3 1 4 4 3 0 2 7 1 2 7 3 3 1 2 9 4 0 4 5 7 h(x) = f(g(x)); a = 0 h' (0) =arrow_forward
- Use the information in the following table to find h' (a) at the given value for a. x f(x) g(x) f'(x) g'(x) 0 0 3 2 1 1 0 0 2 0 2 43 22 4 3 3 2 3 1 1 4 1 2 0 4 2 h(x) = (1/(2) ²; 9(x) h' (3)= = ; a=3arrow_forwardThe position of a moving hockey puck after t seconds is s(t) = tan a. Find the velocity of the hockey puck at any time t. v(t) ===== b. Find the acceleration of the puck at any time t. -1 a (t) = (t) where s is in meters. c. Evaluate v(t) and a (t) for t = 1, 4, and 5 seconds. Round to 4 decimal places, if necessary. v (1) v (4) v (5) a (1) = = = = a (4) = a (5) = d. What conclusion can be drawn from the results in the previous part? ○ The hockey puck is decelerating/slowing down at 1, 4, and 5 seconds ○ The hockey puck has a constant velocity/speed at 1, 4, and 5 seconds ○ The hockey puck is accelerating/speeding up at 1, 4, and 5 secondsarrow_forwardIf the average price of a new one family home is $246,300 with a standard deviation of $15,000 find the minimum and maximum prices of the houses that a contractor will build to satisfy 88% of the market valuearrow_forward
- T={(−7,1),(1,−1),(6,−8),(2,8)} Find the domain and range of the inverse. Express your answer as a set of numbers.arrow_forwardT={(−7,1),(1,−1),(6,−8),(2,8)}. Find the inverse. Express your answer as a set of ordered pairs.arrow_forwardStarting with the finished version of Example 6.2, attached, change the decision criterion to "maximize expected utility," using an exponential utility function with risk tolerance $5,000,000. Display certainty equivalents on the tree. a. Keep doubling the risk tolerance until the company's best strategy is the same as with the EMV criterion—continue with development and then market if successful. The risk tolerance must reach $ 160,000,000 before the risk averse company acts the same as the EMV-maximizing company. b. With a risk tolerance of $320,000,000, the company views the optimal strategy as equivalent to receiving a sure $____________ , even though the EMV from the original strategy (with no risk tolerance) is $ 59,200.arrow_forward
arrow_back_ios
SEE MORE QUESTIONS
arrow_forward_ios
Recommended textbooks for you
 Glencoe Algebra 1, Student Edition, 9780079039897...AlgebraISBN:9780079039897Author:CarterPublisher:McGraw Hill
 Holt Mcdougal Larson Pre-algebra: Student Edition...AlgebraISBN:9780547587776Author:HOLT MCDOUGALPublisher:HOLT MCDOUGAL
 Big Ideas Math A Bridge To Success Algebra 1: Stu...AlgebraISBN:9781680331141Author:HOUGHTON MIFFLIN HARCOURTPublisher:Houghton Mifflin Harcourt
Glencoe Algebra 1, Student Edition, 9780079039897...
Algebra
ISBN:9780079039897
Author:Carter
Publisher:McGraw Hill
Holt Mcdougal Larson Pre-algebra: Student Edition...
Algebra
ISBN:9780547587776
Author:HOLT MCDOUGAL
Publisher:HOLT MCDOUGAL
Big Ideas Math A Bridge To Success Algebra 1: Stu...
Algebra
ISBN:9781680331141
Author:HOUGHTON MIFFLIN HARCOURT
Publisher:Houghton Mifflin Harcourt
Matrix Operations Full Length; Author: ProfRobBob;https://www.youtube.com/watch?v=K5BLNZw7UeU;License: Standard YouTube License, CC-BY
Intro to Matrices; Author: The Organic Chemistry Tutor;https://www.youtube.com/watch?v=yRwQ7A6jVLk;License: Standard YouTube License, CC-BY