
Videos
Parents are frequently concerned when their child seems slow to begin walking (although when the child finally walks, the resulting havoc sometimes has the parents wishing they could turn back the clock!). The article “Walking in the Newborn” (Science, 176 [1972]: 314–315) reported on an experiment in which the effects of several different treatments on the age at which a child first walks were compared.
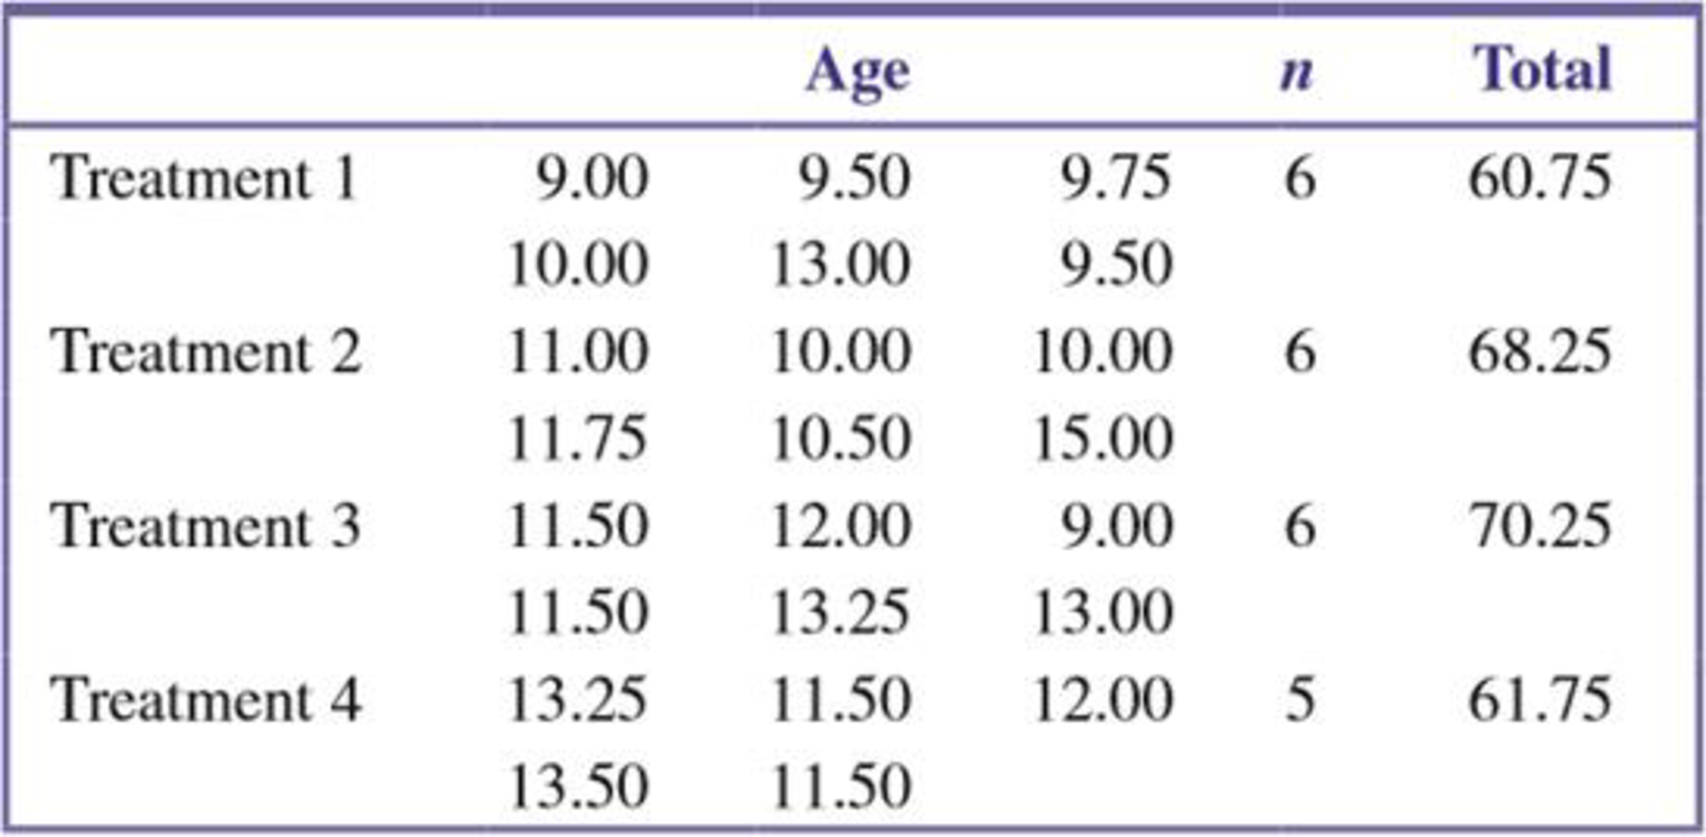
Children in the first group were given special walking exercises for 12 minutes per day beginning at age 1 week and lasting 7 weeks. The second group of children received daily exercises but not the walking exercises administered to the first group. The third and fourth groups were control groups: They received no special treatment and differed only in that the third group’s progress was checked weekly, whereas the fourth group’s progress was checked just once at the end of the study.
Observations on age (in months) when the children first walked are shown in the accompanying table. Also given is the ANOVA table, obtained from the SPSS statistical software package.
Analysis of Variance
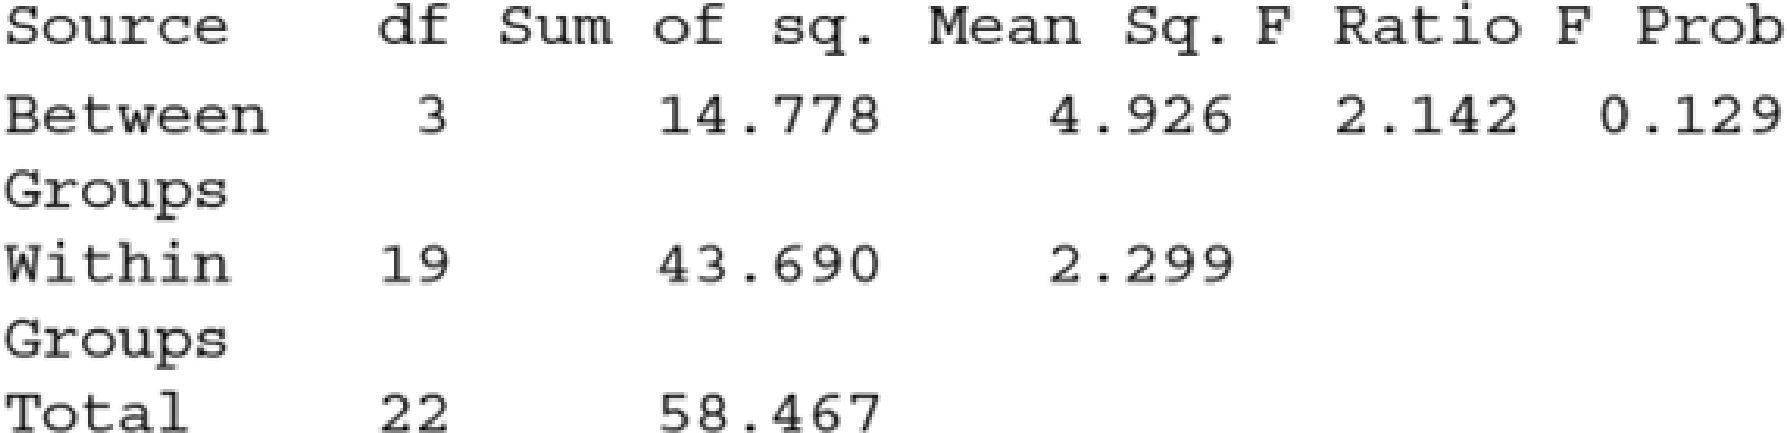
- a. Verify the entries in the ANOVA table.
- b. State and test the relevant hypotheses using a significance level of 0.05.

Trending nowThis is a popular solution!

Chapter 15 Solutions
Introduction to Statistics and Data Analysis


- Urban Travel Times Population of cities and driving times are related, as shown in the accompanying table, which shows the 1960 population N, in thousands, for several cities, together with the average time T, in minutes, sent by residents driving to work. City Population N Driving time T Los Angeles 6489 16.8 Pittsburgh 1804 12.6 Washington 1808 14.3 Hutchinson 38 6.1 Nashville 347 10.8 Tallahassee 48 7.3 An analysis of these data, along with data from 17 other cities in the United States and Canada, led to a power model of average driving time as a function of population. a Construct a power model of driving time in minutes as a function of population measured in thousands b Is average driving time in Pittsburgh more or less than would be expected from its population? c If you wish to move to a smaller city to reduce your average driving time to work by 25, how much smaller should the city be?arrow_forwardA random sample of 1000 people with known allergies to poison ivy participated in a recent study. Oil from the poison ivy plant was rubbed on a patch of skin. For 500 of the subjects, the oil it was washed off within 5 minutes. For the other 500 subjects, the oil was washed off after 5 minutes. Observed reactions were recorded as "none," "mild," or "strong." The results are summarized in the following table. Reaction Within 5 Minutes After 5 Minutes Row Total NoneMildStrong 4056530 48326126 453391156 Column Total 500 500 1000 Suppose a person selected at random from this sample of 1000 subjects. What is the probability that a strong reaction was observed, given that the oil was washed off within 5 minutes?arrow_forwardExample 5: A corporation psychologist believes that exercise affects self image. To investigate this possibility, 14 employees of the corporation are randomly selected to participate in a jogging programme. Before beginning the programme, they are given a questionnaire that measure self-image. Then they begin the jogging programme. The programme consists of jogging at a moderately taxing rate for 20 minutes a day, 4 days a week. Each employee's self-image is measured again after 2 months on the programme. The results are shown below (the higher the score, the higher the self-image); a score of 20 is the highest score possible. Subject 1 3 4 5 6 9. 10 11 12 13 14 Before Jogging 14 13 8. 14 12 7 10 16 10 14 15 12 9. After Jogging 20 16 15 12 15 13 12 13 16 18 14 17 18 15 (a) What is the alternative hypothesis? Use a non-directional hypothesis. (b) What is the null hypothesis? (c) Using a = (d) What error may you be making by your conclusion in part (c)? (e) To what population does your…arrow_forward
- Section 9.1 Question #7 Rhino viruses typically cause common colds. In a test of the effectiveness of echinacea, 35 of the 42 subjects treated with echinacea developed rhinovirus infections. In a placebo group, 85 of the 99 subjects developed rhinovirus infections. Use a 0.05 significance level to test the claim that echinacea has an effect on rhinovirus infections. Complete parts (a) through (c) below. a. Test the claim using a hypothesis test. Consider the first sample to be the sample of subjects treated with echinacea and the second sample to be the sample of subjects treated with a placebo. What are the null and alternative hypotheses for the hypothesis test? A. H0: p1 = p2 H1: p1 > p2 B. H0: p1 ≠ p2 H1: p1 = p2 C. H0: p1 ≤ p2 H1: p1 ≠ p2 D. H0: p1 = p2 H1: p1 < p2 E. H0: p1 = p2 H1: p1 ≠ p2 F. H0: p1 ≥ p2 H1: p1 ≠ p2 Identify the test statistic. z= ____________ (Round to two decimal places as needed.) Identify the…arrow_forwardPractitioners of a controversial medical practice known as therapeutic touch claim that they can manipulate a person's human energy field to provide healing powers, without actually touching the patient's body. Emily Rosa, an 11-year-old in Colorado, recruited 21 practitioners of therapeutic touch in a study she conducted in 1996 (Rosa et al., 1998). Her study consisted of placing a screen between a subject's eyes and hands. For several trials, she hovered her hand over one of theirs, flipping a coin each time to decide which hand to hold hers over. She then asked the practitioner to decide which of their hands her hand was near to see whether or not the practitioner could detect Emily's energy field. Combining the results of the 21 subjects, there were a total of 123 correct identifications in 280 repetitions of the experiment. Use these sample data to conduct the test of the hypotheses specified in part. What is the z and p value (3 decimals for z) (4 decimals for p- value)arrow_forward(2.16) Table 2.12 comes from one of the first studies of the link between lung cancer and smoking, by Richard Doll and A. Bradford Hill. In 20 hospitals in London, UK, patients admitted with lung cancer in the previous year were queried about their smoking behavior. For each patient admitted, researchers studied the smoking behavior of a noncancer control patient at the same hospital of the same sex and within the same 5-year grouping on age. A smoker was defined as a person who had smoked at least one cigarette a day for at least a year. Table 2.12. Data for Problem 2.16 Cases 688 21 709 Lung Cancer Have Smoked Yes No Total Based on data reported in Table IV, R. Doll and A. B. Hill, Br. Med. J., 739-748, September 30, 1950. Controls 650 59 709 a) Identify the response variable and the explanatory variable. b) Identify the type of study this was. c) Can you use these data to compare smokers with nonsmokers in terms of the proportion who suffered lung cancer? Why or why not? d)…arrow_forward
- In his doctoral thesis, L. A. Beckel (University of Minnesota, 1982) studied the social behavior of river otters during the mating season. An important role in the bonding process of river otters is very short periods of social grooming. After extensive observations, Dr. Beckel found that one group of river otters under study had a frequency of initiating grooming of approximately 1.7 for each 10 minutes. Suppose that you are observing river otters for 30 minutes. Let r = 0, 1, 2, ... be a random variable that represents the number of times (in a 30-minute interval) one otter initiates social grooming of another. a) Find the probabilities that in your 30 minutes of observation, one otter will initiate social grooming four times, five times, and six times. (Round your answers to four decimal places.) P(4) = P(5) = P(6) = b) Find the probability that one otter will initiate social grooming less than four times during the 30-minute observation period. (Round your answer…arrow_forwardSection 9.3 Question #5 Several students were tested for reaction times (in thousandths of a second) using their right and left hands. (Each value is the elapsed time between the release of a strip of paper and the instant that it is caught by the subject.) Results from five of the students are included in the graph to the right. Use a 0.02 significance level to test the claim that there is no difference between the reaction times of the right and left hands. View the reaction time data table. Reaction time data table Right Hand Left Hand 102 125 126 139 144 155 187 182 160 199 What are the hypotheses for this test? Let μd be the _____________ ( A. mean of the differences, B. difference between the means ) of the right and left hand reaction times. H0: μd ________ ( A. =, B. ≠, C. <, D. >, E. ≤, F. ≥ ) 0 H1: μd _______ ( A. =, B. ≠, C. <, D. >, E. ≤, F. ≥ ) 0 What is the test statistic? t=…arrow_forwardch 15 end. 6: In the book Business Research Methods (5th ed.), Donald R. Cooper and C. William Emory discuss studying the relationship between on-the-job accidents and smoking. Cooper and Emory describe the study as follows: Suppose a manager implementing a smoke-free workplace policy is interested in whether smoking affects worker accidents. Since the company has complete reports of on-the-job accidents, she draws a sample of names of workers who were involved in accidents during the last year. A similar sample from among workers who had no reported accidents in the last year is drawn. She interviews members of both groups to determine if they are smokers or not.arrow_forward
 Functions and Change: A Modeling Approach to Coll...AlgebraISBN:9781337111348Author:Bruce Crauder, Benny Evans, Alan NoellPublisher:Cengage Learning
 Linear Algebra: A Modern IntroductionAlgebraISBN:9781285463247Author:David PoolePublisher:Cengage Learning
 Holt Mcdougal Larson Pre-algebra: Student Edition...AlgebraISBN:9780547587776Author:HOLT MCDOUGALPublisher:HOLT MCDOUGAL
 Glencoe Algebra 1, Student Edition, 9780079039897...AlgebraISBN:9780079039897Author:CarterPublisher:McGraw Hill