
Videos
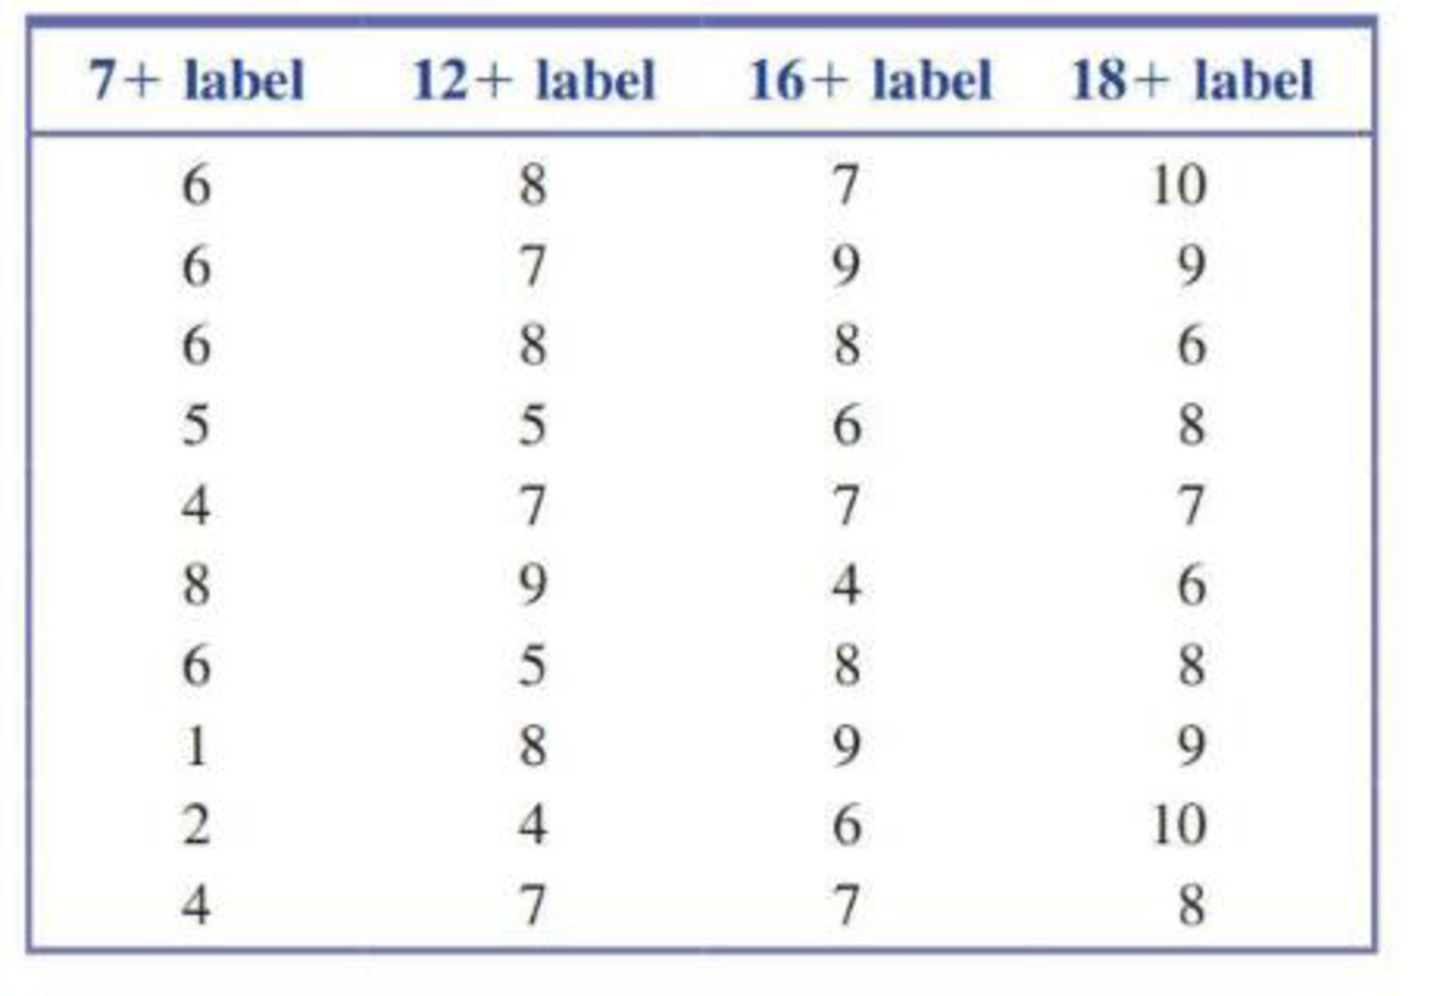
The paper referenced in the previous exercise also gave data for 12- to 13-year-old girls. Data consistent with summary values in the paper are shown below. Do the data provide convincing evidence that the
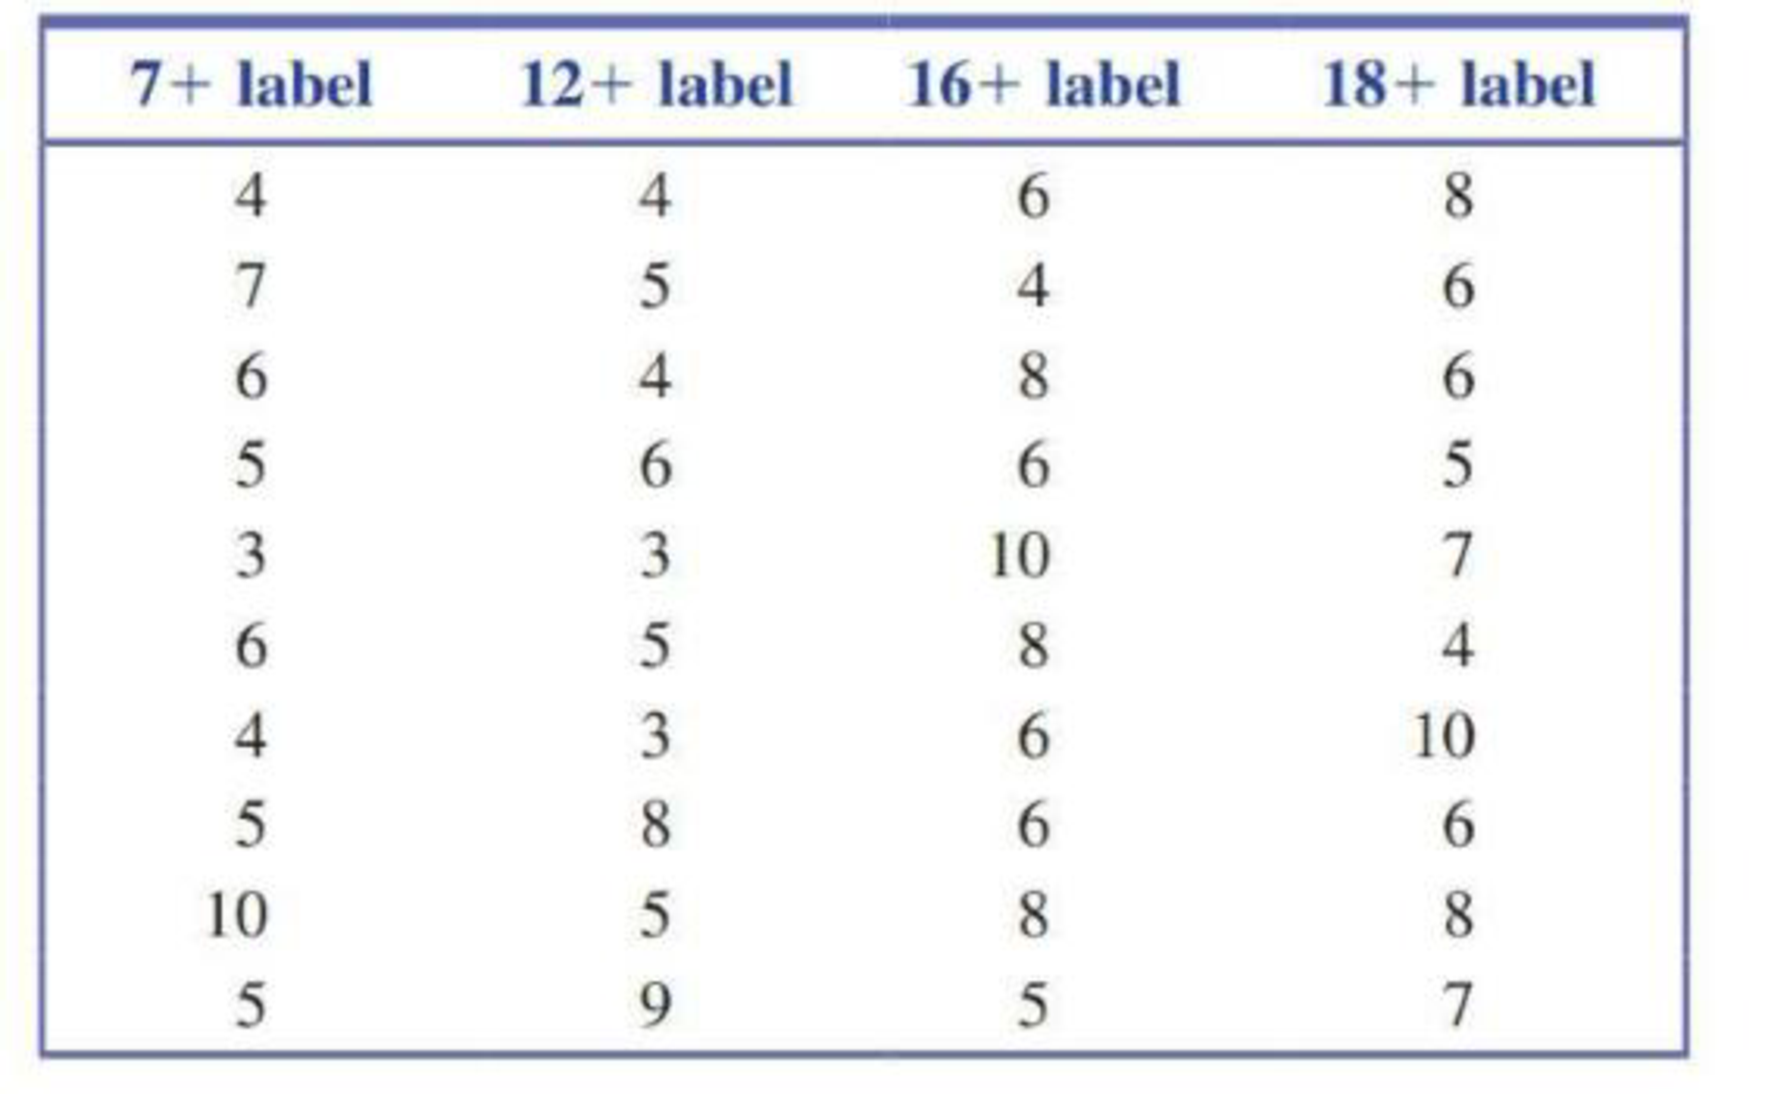
15.5 The authors of the paper “Age and Violent Content Labels Make Video Games Forbidden Fruits for Youth” (Pediatrics [2009]: 870–876) carried out an experiment to determine if restrictive labels on video games actually increased the attractiveness of the game for young game players. Participants read a description of a new video game and were asked how much they wanted to play the game. The description also included an age rating. Some participants read the description with an age restrictive label of 7 +, indicating that the game was not appropriate for children under the age of 7. Others read the same description, but with an age restrictive label of 12+, 16+, or 18 +.
The data on the following page for 12- to 13-year-old boys are consistent with summary statistics given in the paper. (The sample sizes in the actual experiment were larger.) For purposes of this exercise, you can assume that the boys were assigned at random to one of the four age label treatments (7+, 12+, 16 +, and 18 +). Data shown are the boys’ ratings of how much they wanted to play the game on a scale of 1 to 10.
Do the data provide convincing evidence that the means of the ratings associated with the game descriptions by 12- to 13-year-old boys are not the same for all four restrictive rating labels? Test the appropriate hypotheses using a significance level of 0.05. (Hint: See Example 15.4.)
Want to see the full answer?
Check out a sample textbook solution
Chapter 15 Solutions
Introduction to Statistics and Data Analysis


- Question 6: Negate the following compound statements, using De Morgan's laws. A) If Alberta was under water entirely then there should be no fossil of mammals.arrow_forwardNegate the following compound statement using De Morgans's laws.arrow_forwardCharacterize (with proof) all connected graphs that contain no even cycles in terms oftheir blocks.arrow_forward
- Let G be a connected graph that does not have P4 or C3 as an induced subgraph (i.e.,G is P4, C3 free). Prove that G is a complete bipartite grapharrow_forwardProve sufficiency of the condition for a graph to be bipartite that is, prove that if G hasno odd cycles then G is bipartite as follows:Assume that the statement is false and that G is an edge minimal counterexample. That is, Gsatisfies the conditions and is not bipartite but G − e is bipartite for any edge e. (Note thatthis is essentially induction, just using different terminology.) What does minimality say aboutconnectivity of G? Can G − e be disconnected? Explain why if there is an edge between twovertices in the same part of a bipartition of G − e then there is an odd cyclearrow_forwardLet G be a connected graph that does not have P4 or C4 as an induced subgraph (i.e.,G is P4, C4 free). Prove that G has a vertex adjacent to all othersarrow_forward
- We consider a one-period market with the following properties: the current stock priceis S0 = 4. At time T = 1 year, the stock has either moved up to S1 = 8 (with probability0.7) or down towards S1 = 2 (with probability 0.3). We consider a call option on thisstock with maturity T = 1 and strike price K = 5. The interest rate on the money marketis 25% yearly.(a) Find the replicating portfolio (φ, ψ) corresponding to this call option.(b) Find the risk-neutral (no-arbitrage) price of this call option.(c) We now consider a put option with maturity T = 1 and strike price K = 3 onthe same market. Find the risk-neutral price of this put option. Reminder: A putoption gives you the right to sell the stock for the strike price K.1(d) An investor with initial capital X0 = 0 wants to invest on this market. He buysα shares of the stock (or sells them if α is negative) and buys β call options (orsells them is β is negative). He invests the cash balance on the money market (orborrows if the amount is…arrow_forwardDetermine if the two statements are equivalent using a truth tablearrow_forwardQuestion 4: Determine if pair of statements A and B are equivalent or not, using truth table. A. (~qp)^~q в. р л~9arrow_forward
- Determine if the two statements are equalivalent using a truth tablearrow_forwardQuestion 3: p and q represent the following simple statements. p: Calgary is the capital of Alberta. A) Determine the value of each simple statement p and q. B) Then, without truth table, determine the va q: Alberta is a province of Canada. for each following compound statement below. pvq р^~q ~рл~q ~q→ p ~P~q Pq b~ (d~ ← b~) d~ (b~ v d) 0 4arrow_forward2. Let X be a random variable. (a) Show that, if E X2 = 1 and E X4arrow_forwardarrow_back_iosSEE MORE QUESTIONSarrow_forward_ios
 Glencoe Algebra 1, Student Edition, 9780079039897...AlgebraISBN:9780079039897Author:CarterPublisher:McGraw Hill
 Big Ideas Math A Bridge To Success Algebra 1: Stu...AlgebraISBN:9781680331141Author:HOUGHTON MIFFLIN HARCOURTPublisher:Houghton Mifflin Harcourt
 College Algebra (MindTap Course List)AlgebraISBN:9781305652231Author:R. David Gustafson, Jeff HughesPublisher:Cengage Learning
 Holt Mcdougal Larson Pre-algebra: Student Edition...AlgebraISBN:9780547587776Author:HOLT MCDOUGALPublisher:HOLT MCDOUGAL