
(a)
Interpretation:
Whether the carbocation formed by protonation of isoprene at
Concept introduction:
The delocalization of electrons results in the formation of resonance structure. The curved-arrow notation traces the flow of the electrons in a compound. This notation is used to derive the resonance structure.
Answer to Problem 15.65AP
The carbocation which is formed by protonation of isoprene at
Explanation of Solution
The given structure of isoprene is shown below.
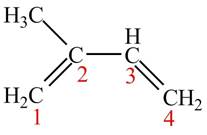
Figure 1
At the time of protonation at carbon
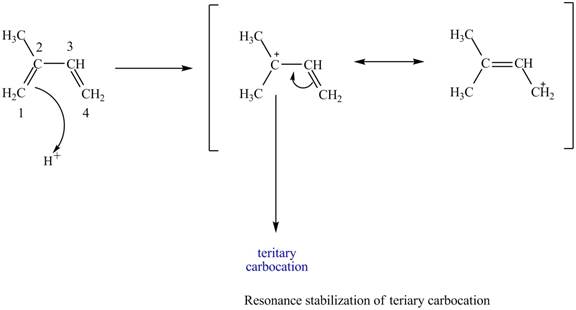
Figure 2
At the time of protonation at carbon
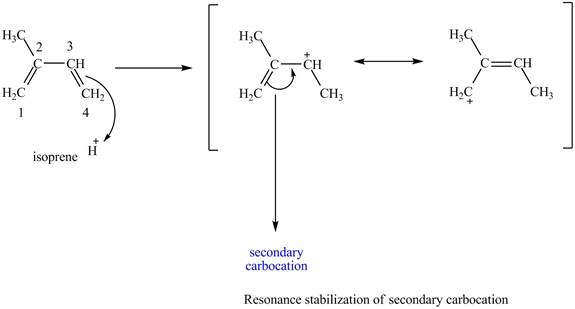
Figure 3
The more stable carbocation is selected on the basis of inductive effect as both carbocation at carbon
Therefore, tertiary carbocation formed at carbon
The carbocation which is formed by protonation of isoprene at
(b)
Interpretation:
The products that are formed by the addition of one equivalent of
Concept introduction:
The delocalization of electrons results in the formation of resonance structure. The curved-arrow notation traces the flow of the electrons in a compound. This notation is used to derive the resonance structure.
Answer to Problem 15.65AP
The products that are formed by the addition of one equivalent of
Explanation of Solution
The given structure of isoprene is shown below.
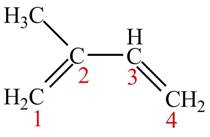
Figure 1
An isoprene always forms the
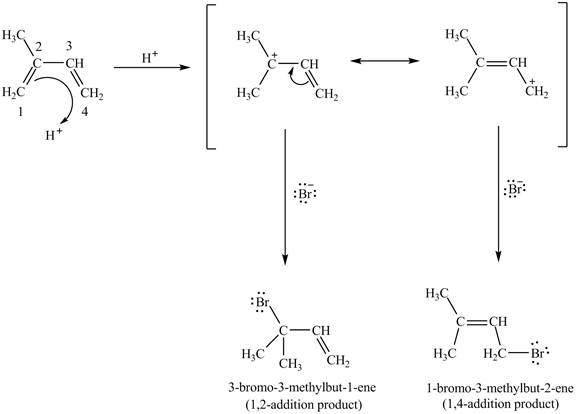
Figure 4
Therefore, the products formed by the conjugated diene, isoprene are
The products,
(c)
Interpretation:
The products that are formed the addition of one equivalent of
Concept introduction:
The delocalization of electrons results in the formation of resonance structure. The curved-arrow notation traces the flow of the electrons in a compound. This notation is used to derive the resonance structure.
Answer to Problem 15.65AP
The products that are formed the addition of one equivalent of
Explanation of Solution
In case of
The protonation of
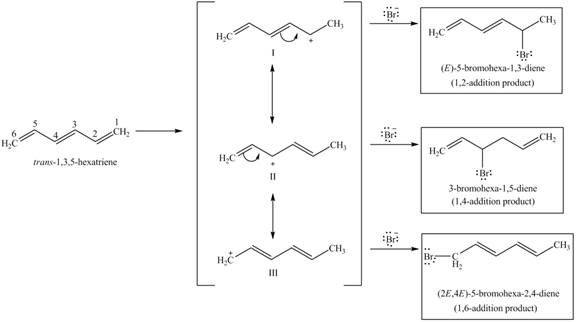
Figure 5
The reaction of
The products,
(d)
Interpretation:
The products which are formed in part (b) and (c) whether kinetically controlled products or
Concept introduction:
In the given conditions of the reaction, if the products of any reaction do not attain the equilibrium then the reaction is known as kinetically controlled reaction.
In the given conditions of the reaction, if the products of any reaction attain the equilibrium then the reaction is known as thermodynamically controlled reaction.
Answer to Problem 15.65AP
In part (b),
In part (c),
Explanation of Solution
The kinetically controlled products are formed much faster than thermodynamically controlled products. So, the
In part (b), the reaction of the given isoprene with
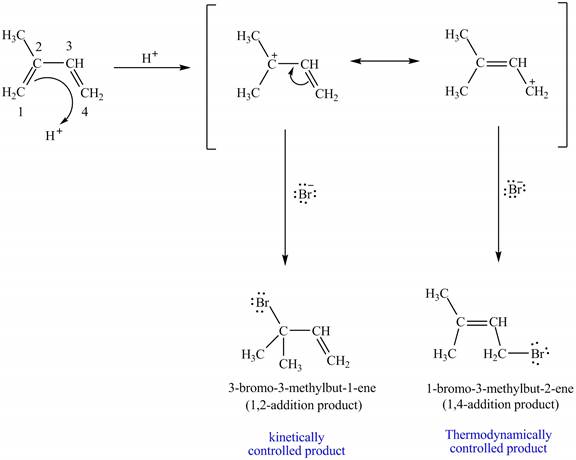
Figure 6
In part (c), the slowest addition is the
Therefore,
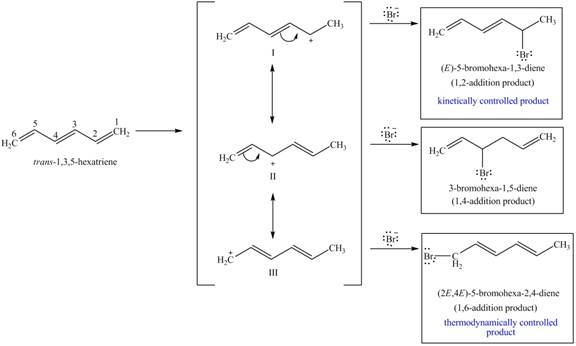
Figure 7
In part (b),
In part (c),
Want to see more full solutions like this?
Chapter 15 Solutions
EBK ORGANIC CHEMISTRY STUDY GUIDE AND S
- 5. Consider the compounds shown below as ligands in coordination chemistry and identify their denticity; comment on their ability to form chelate complexes. (6 points) N N A B N N N IN N Carrow_forward1. Use standard reduction potentials to rationalize quantitatively why: (6 points) (a) Al liberates H2 from dilute HCl, but Ag does not; (b) Cl2 liberates Br2 from aqueous KBr solution, but does not liberate C12 from aqueous KCl solution; c) a method of growing Ag crystals is to immerse a zinc foil in an aqueous solution of AgNO3.arrow_forwardWhat would be the best choices for the missing reagents 1 and 3 in this synthesis? 1 1. PPh3 2. n-BuLi 3 2 • Draw the missing reagents in the drawing area below. You can draw them in any arrangement you like. • Do not draw the missing reagent 2. If you draw 1 correctly, we'll know what it is. • Note: if one of your reagents needs to contain a halogen, use bromine. Click and drag to start drawing a structure. Xarrow_forward
- What is the missing reactant R in this organic reaction? N N H3O+ +R + • Draw the structure of R in the drawing area below. • Be sure to use wedge and dash bonds if it's necessary to draw one particular enantiomer. Click and drag to start drawing a structure. fmarrow_forwardThe product on the right-hand side of this reaction can be prepared from two organic reactants, under the conditions shown above and below the arrow. Draw 1 and 2 below, in any arrangement you like. 1+2 NaBH3CN H+ N Click and drag to start drawing a structure. 5arrow_forwardAssign this HSQC Spectrum ( please editing clearly on the image)arrow_forward
- (a 4 shows scanning electron microscope (SEM) images of extruded actions of packing bed for two capillary columns of different diameters, al 750 (bottom image) and b) 30-μm-i.d. Both columns are packed with the same stationary phase, spherical particles with 1-um diameter. A) When the columns were prepared, the figure shows that the column with the larger diameter has more packing irregularities. Explain this observation. B) Predict what affect this should have on band broadening and discuss your prediction using the van Deemter terms. C) Does this figure support your explanations in application question 33? Explain why or why not and make any changes in your answers in light of this figure. Figure 4 SEM images of sections of packed columns for a) 750 and b) 30-um-i.d. capillary columns.³arrow_forwardfcrip = ↓ bandwidth Il temp 32. What impact (increase, decrease, or no change) does each of the following conditions have on the individual components of the van Deemter equation and consequently, band broadening? Increase temperature Longer column Using a gas mobile phase instead of liquid Smaller particle stationary phase Multiple Paths Diffusion Mass Transferarrow_forward34. Figure 3 shows Van Deemter plots for a solute molecule using different column inner diameters (i.d.). A) Predict whether decreasing the column inner diameters increase or decrease bandwidth. B) Predict which van Deemter equation coefficient (A, B, or C) has the greatest effect on increasing or decreasing bandwidth as a function of i.d. and justify your answer. Figure 3 Van Deemter plots for hydroquinone using different column inner diameters (i.d. in μm). The data was obtained from liquid chromatography experiments using fused-silica capillary columns packed with 1.0-μm particles. 35 20 H(um) 큰 20 15 90 0+ 1500 100 75 550 01 02 594 05 μ(cm/sec) 30 15 10arrow_forward
- elow are experimentally determined van Deemter plots of column efficiency, H, vs. flow rate. H is a quantitative measurement of band broadening. The left plot is for a liquid chromatography application and the night is for gas chromatography. Compare and contrast these two plots in terms of the three band broadening mechanisms presented in this activity. How are they similar? How do they differ? Justify your answers.? 0.4 H (mm) 0.2 0.1- 0.3- 0 0.5 H (mm) 8.0 7.0 6.0 5.0 4.0- 3.0 T +++ 1.0 1.5 0 2.0 4.0 Flow Rate, u (cm/s) 6.0 8.0 Flow Rate, u (cm/s)arrow_forwardPredict the products of this organic reaction: + H ZH NaBH3CN H+ n. ? Click and drag to start drawing a structure. Xarrow_forwardWhat is the missing reactant R in this organic reaction? + R H3O+ + • Draw the structure of R in the drawing area below. • Be sure to use wedge and dash bonds if it's necessary to draw one particular enantiomer. Click and drag to start drawing a structure.arrow_forward
