
Videos
Preschool The ages (in months) at which 50 children were first enrolled in a preschool are listed below.
38 40 30 35 39 40 48 36 31 36
47 35 34 43 41 36 41 43 48 40
32 34 41 30 46 35 40 30 46 37
55 39 33 32 32 45 42 41 36 50
42 50 37 39 33 45 38 46 36 31
a. Construct a stem and leaf display for the data.
b. Construct a relative frequency histogram for these data. Start the lower boundary of the first class at 30 and use a class width of 5 months.
c. Compare the graphs in parts a and b. Are there any significant differences that would cause you to choose one as the better method for displaying the data?
d. What proportion of the children were 35 months (2 years. 11 months) or older, but less than 45 months (3 years. 9 months) of age when first enrolled in preschool?
e. If one child were selected at random from this group of children, what is the probability that the child was less than 50 months old (4 years. 2 months) when first enrolled in preschool?
(a)
To construct a stem and leaf display for the data given in the question.
Answer to Problem 1.28E
The stem and leaf display is below as:-
| Stem | Leaf |
| 3 | 0 0 0 1 1 2 2 2 3 3 4 4 5 5 5 6 6 6 6 6 7 7 8 8 9 9 9 |
| 4 | 0 0 0 0 1 1 1 1 2 2 3 3 5 5 6 6 6 7 8 |
| 5 | 0 0 5 |
| 6 | |
| 7 | 8 |
Explanation of Solution
The set of data is given in the question.
Each observation in the data is dividedbetween the ones and the tens place. The number to the left is the stem and the number to the right is the leaf.
(b)
To construct a relative frequency histogram for the data given in the question.
Answer to Problem 1.28E
The relative frequency histogram is as follows:-
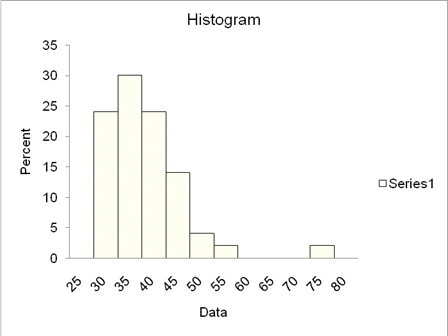
Explanation of Solution
The observations are given in the question.
By considering the observations, Relative frequency distribution is constructed with the lower boundary of the first class at 30 and the class width of 5 months.
(c)
To compare the graphs in (a) and (b) and also to find if there is any significant differences that would cause us to choose one as the better method for displaying the data.
Answer to Problem 1.28E
The graphs in (a) and (b) are both skewed to the right but in (a) the data is displayed in horizontal view and in (b) the data is displayed in the vertical view.
Yes, there is significant difference in the view and also the vertical view is more convenient way to display and understand the data i.e. in (b) than in (a).
Explanation of Solution
The graph in (a) is stem and leaf in which each observation in the data is divided between the ones and the tens place. The number to the left is the stem and the number to the right is the leaf. This is displayed in horizontal view.
And the graph in (b) is arelative frequency histogramfor a quantitative data set is a bar graph in which the height of the bar shows “how often” (measured as a proportion or relative frequency) measurements fall in a particular class or subinterval. This is displayed in vertical view.
Both the graphs are skewed to the right by looking at the graph in both the parts.
And also the data can be better understandable and easy to view in vertical form. Thus, the graph in part (b) is better method for displaying the data.
(d)
To calculate the proportion of the children who are
Answer to Problem 1.28E
The proportion of the children who are
Explanation of Solution
By looking at the relative frequency data from the histogram, we get that:-
| Data | cumulative | |||||||
| lower | upper | midpoint | width | frequency | percent | frequency | percent | |
| 25 | < | 30 | 28 | 5 | 0 | 0.0 | 0 | 0.0 |
| 30 | < | 35 | 33 | 5 | 12 | 24.0 | 12 | 24.0 |
| 35 | < | 40 | 38 | 5 | 15 | 30.0 | 27 | 54.0 |
| 40 | < | 45 | 43 | 5 | 12 | 24.0 | 39 | 78.0 |
| 45 | < | 50 | 48 | 5 | 7 | 14.0 | 46 | 92.0 |
| 50 | < | 55 | 53 | 5 | 2 | 4.0 | 48 | 96.0 |
| 55 | < | 60 | 58 | 5 | 1 | 2.0 | 49 | 98.0 |
| 60 | < | 65 | 63 | 5 | 0 | 0.0 | 49 | 98.0 |
| 65 | < | 70 | 68 | 5 | 0 | 0.0 | 49 | 98.0 |
| 70 | < | 75 | 73 | 5 | 0 | 0.0 | 49 | 98.0 |
| 75 | < | 80 | 77 | 5 | 1 | 2.0 | 50 | 100.0 |
| 50 | 100.0 | |||||||
That there are
Thus, we have,
(e)
To calculate the probability that the child was less than
Answer to Problem 1.28E
Explanation of Solution
To find the probability that the child was less than
First calculate the number of children who are less than
The number of children who are less than
Secondly we have to calculate the total number of children in the group that are
Thus, the probability that the child was less than
Therefore,
Want to see more full solutions like this?
Chapter 1 Solutions
Introduction to Probability and Statistics


- solve the question based on hw 1, 1.41arrow_forwardT1.4: Let ẞ(G) be the minimum size of a vertex cover, a(G) be the maximum size of an independent set and m(G) = |E(G)|. (i) Prove that if G is triangle free (no induced K3) then m(G) ≤ a(G)B(G). Hints - The neighborhood of a vertex in a triangle free graph must be independent; all edges have at least one end in a vertex cover. (ii) Show that all graphs of order n ≥ 3 and size m> [n2/4] contain a triangle. Hints - you may need to use either elementary calculus or the arithmetic-geometric mean inequality.arrow_forwardWe consider the one-period model studied in class as an example. Namely, we assumethat the current stock price is S0 = 10. At time T, the stock has either moved up toSt = 12 (with probability p = 0.6) or down towards St = 8 (with probability 1−p = 0.4).We consider a call option on this stock with maturity T and strike price K = 10. Theinterest rate on the money market is zero.As in class, we assume that you, as a customer, are willing to buy the call option on100 shares of stock for $120. The investor, who sold you the option, can adopt one of thefollowing strategies: Strategy 1: (seen in class) Buy 50 shares of stock and borrow $380. Strategy 2: Buy 55 shares of stock and borrow $430. Strategy 3: Buy 60 shares of stock and borrow $480. Strategy 4: Buy 40 shares of stock and borrow $280.(a) For each of strategies 2-4, describe the value of the investor’s portfolio at time 0,and at time T for each possible movement of the stock.(b) For each of strategies 2-4, does the investor have…arrow_forward
- Negate the following compound statement using De Morgans's laws.arrow_forwardNegate the following compound statement using De Morgans's laws.arrow_forwardQuestion 6: Negate the following compound statements, using De Morgan's laws. A) If Alberta was under water entirely then there should be no fossil of mammals.arrow_forward
- Negate the following compound statement using De Morgans's laws.arrow_forwardCharacterize (with proof) all connected graphs that contain no even cycles in terms oftheir blocks.arrow_forwardLet G be a connected graph that does not have P4 or C3 as an induced subgraph (i.e.,G is P4, C3 free). Prove that G is a complete bipartite grapharrow_forward
 Holt Mcdougal Larson Pre-algebra: Student Edition...AlgebraISBN:9780547587776Author:HOLT MCDOUGALPublisher:HOLT MCDOUGAL
 Glencoe Algebra 1, Student Edition, 9780079039897...AlgebraISBN:9780079039897Author:CarterPublisher:McGraw Hill
 Big Ideas Math A Bridge To Success Algebra 1: Stu...AlgebraISBN:9781680331141Author:HOUGHTON MIFFLIN HARCOURTPublisher:Houghton Mifflin Harcourt