
Videos
a.
To find: The relative frequency histogram for the data.
a.
Answer to Problem 1.48SE
The relative frequency histogram for the data is shown in Figure-1.
Explanation of Solution
Given information: The data is shown below.
| 8.9 | 12.3 | 10.7 | 8.4 | 7.8 | 11.5 | 8.2 | 9.0 | 8.8 |
| 7.1 | 11.8 | 10.3 | 7.7 | 9.0 | 10.5 | 9.1 | 8.7 | 8.7 |
| 9.1 | 9.0 | 10.5 | 11.2 | 7.7 | 8.8 | 12.2 | 7.9 | 8.8 |
| 8.7 | 7.1 | 8.7 | 7.6 | 5.1 | 35.1 | 10.5 | 10.4 | 11.0 |
| 10.2 | 8.6 | 10.7 | 9.6 | 8.3 | 8.0 | 9.5 | 7.7 | 9.4 |
| 8.7 | 7.8 | 10.2 | 6.9 | 9.2 | 10.2 | 6.2 | 9.6 | 12.2 |
Calculation:
The histogram is shown below.
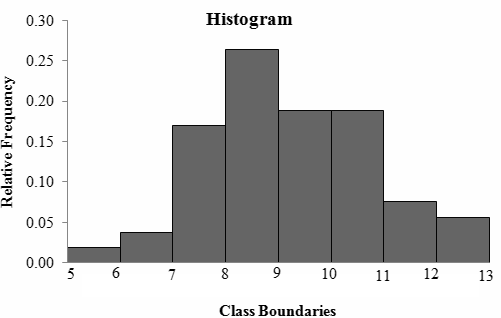
Figure-1
Thus, the histogram for the data is shown in Figure-1.
b.
To explain:Whether the observation describes the geography of the city.
b.
Explanation of Solution
Given information: The data is shown below.
| 8.9 | 12.3 | 10.7 | 8.4 | 7.8 | 11.5 | 8.2 | 9.0 | 8.8 |
| 7.1 | 11.8 | 10.3 | 7.7 | 9.0 | 10.5 | 9.1 | 8.7 | 8.7 |
| 9.1 | 9.0 | 10.5 | 11.2 | 7.7 | 8.8 | 12.2 | 7.9 | 8.8 |
| 8.7 | 7.1 | 8.7 | 7.6 | 5.1 | 35.1 | 10.5 | 10.4 | 11.0 |
| 10.2 | 8.6 | 10.7 | 9.6 | 8.3 | 8.0 | 9.5 | 7.7 | 9.4 |
| 8.7 | 7.8 | 10.2 | 6.9 | 9.2 | 10.2 | 6.2 | 9.6 | 12.2 |
Since, the highest peak in the Mount Washington is at 6288 ft which is famous for the erratic weather but the recorded value is an outlier with respect to the geographical location of the city.
c.
To explain:Whether the wind is unusual.
c.
Explanation of Solution
Given information: The data is shown below.
| 8.9 | 12.3 | 10.7 | 8.4 | 7.8 | 11.5 | 8.2 | 9.0 | 8.8 |
| 7.1 | 11.8 | 10.3 | 7.7 | 9.0 | 10.5 | 9.1 | 8.7 | 8.7 |
| 9.1 | 9.0 | 10.5 | 11.2 | 7.7 | 8.8 | 12.2 | 7.9 | 8.8 |
| 8.7 | 7.1 | 8.7 | 7.6 | 5.1 | 35.1 | 10.5 | 10.4 | 11.0 |
| 10.2 | 8.6 | 10.7 | 9.6 | 8.3 | 8.0 | 9.5 | 7.7 | 9.4 |
| 8.7 | 7.8 | 10.2 | 6.9 | 9.2 | 10.2 | 6.2 | 9.6 | 12.2 |
Since, the relative frequency is
Thus, the observation is usually windy.
Want to see more full solutions like this?
Chapter 1 Solutions
Introduction to Probability and Statistics


- Calculate the 95% confidence interval around your estimate of r using Fisher’s z-transformation. In your final answer, make sure to back-transform to the original units.arrow_forwardCalculate Pearson’s correlation coefficient (r) between temperature and heart rate.arrow_forwardCalculate the least squares regression line and write the equation.arrow_forward
- Business discussarrow_forwardBUSINESS DISCUSSarrow_forwardA researcher wishes to estimate, with 90% confidence, the population proportion of adults who support labeling legislation for genetically modified organisms (GMOs). Her estimate must be accurate within 4% of the true proportion. (a) No preliminary estimate is available. Find the minimum sample size needed. (b) Find the minimum sample size needed, using a prior study that found that 65% of the respondents said they support labeling legislation for GMOs. (c) Compare the results from parts (a) and (b). ... (a) What is the minimum sample size needed assuming that no prior information is available? n = (Round up to the nearest whole number as needed.)arrow_forward
- The table available below shows the costs per mile (in cents) for a sample of automobiles. At a = 0.05, can you conclude that at least one mean cost per mile is different from the others? Click on the icon to view the data table. Let Hss, HMS, HLS, Hsuv and Hмy represent the mean costs per mile for small sedans, medium sedans, large sedans, SUV 4WDs, and minivans respectively. What are the hypotheses for this test? OA. Ho: Not all the means are equal. Ha Hss HMS HLS HSUV HMV B. Ho Hss HMS HLS HSUV = μMV Ha: Hss *HMS *HLS*HSUV * HMV C. Ho Hss HMS HLS HSUV =μMV = = H: Not all the means are equal. D. Ho Hss HMS HLS HSUV HMV Ha Hss HMS HLS =HSUV = HMVarrow_forwardQuestion: A company launches two different marketing campaigns to promote the same product in two different regions. After one month, the company collects the sales data (in units sold) from both regions to compare the effectiveness of the campaigns. The company wants to determine whether there is a significant difference in the mean sales between the two regions. Perform a two sample T-test You can provide your answer by inserting a text box and the answer must include: Null hypothesis, Alternative hypothesis, Show answer (output table/summary table), and Conclusion based on the P value. (2 points = 0.5 x 4 Answers) Each of these is worth 0.5 points. However, showing the calculation is must. If calculation is missing, the whole answer won't get any credit.arrow_forwardBinomial Prob. Question: A new teaching method claims to improve student engagement. A survey reveals that 60% of students find this method engaging. If 15 students are randomly selected, what is the probability that: a) Exactly 9 students find the method engaging?b) At least 7 students find the method engaging? (2 points = 1 x 2 answers) Provide answers in the yellow cellsarrow_forward
 Holt Mcdougal Larson Pre-algebra: Student Edition...AlgebraISBN:9780547587776Author:HOLT MCDOUGALPublisher:HOLT MCDOUGAL
 Glencoe Algebra 1, Student Edition, 9780079039897...AlgebraISBN:9780079039897Author:CarterPublisher:McGraw Hill
 Big Ideas Math A Bridge To Success Algebra 1: Stu...AlgebraISBN:9781680331141Author:HOUGHTON MIFFLIN HARCOURTPublisher:Houghton Mifflin Harcourt
 Functions and Change: A Modeling Approach to Coll...AlgebraISBN:9781337111348Author:Bruce Crauder, Benny Evans, Alan NoellPublisher:Cengage Learning