Explanation: Given The wave function for the electron in one dimensional system is, Ψ ( x ) = sin x The probability density curve for the function Ψ 2 ( x ) = sin 2 x contains all the positive values of the given function over the whole range. Therefore, the probability density curve for the given function is, Figure 1 (b) Explanation: Given The wave function for the electron in one dimensional system is, Ψ ( x ) = sin x The probability of finding electron for the given function is maximum on the values of x where the probability density curve has the maximum value. For the given function the value of sin x is maximum at the values x = π 2 and x = 3 π 2 . Therefore, the probability density curve for the given function has a peak at these values of x where probability of finding an electron is maximum. (c) Explanation: The wave function for the electron in one dimensional system is, Ψ ( x ) = sin x The probability of finding electron for the given function is minimum on the values of x where the probability density curve has the minimum value. For the given function the value of sin x is zero at the value of x = π . Therefore, the probability density curve for the given function has a node at this value of x where probability of finding electron is nil. Conclusion: (a) The probability density curve for the given function is as follows: (b) The values of x is maximum at x = π 2 and x = 3 π 2 . (c) The probability of finding an electron at x = π is zero and this point is called node.
Explanation: Given The wave function for the electron in one dimensional system is, Ψ ( x ) = sin x The probability density curve for the function Ψ 2 ( x ) = sin 2 x contains all the positive values of the given function over the whole range. Therefore, the probability density curve for the given function is, Figure 1 (b) Explanation: Given The wave function for the electron in one dimensional system is, Ψ ( x ) = sin x The probability of finding electron for the given function is maximum on the values of x where the probability density curve has the maximum value. For the given function the value of sin x is maximum at the values x = π 2 and x = 3 π 2 . Therefore, the probability density curve for the given function has a peak at these values of x where probability of finding an electron is maximum. (c) Explanation: The wave function for the electron in one dimensional system is, Ψ ( x ) = sin x The probability of finding electron for the given function is minimum on the values of x where the probability density curve has the minimum value. For the given function the value of sin x is zero at the value of x = π . Therefore, the probability density curve for the given function has a node at this value of x where probability of finding electron is nil. Conclusion: (a) The probability density curve for the given function is as follows: (b) The values of x is maximum at x = π 2 and x = 3 π 2 . (c) The probability of finding an electron at x = π is zero and this point is called node.
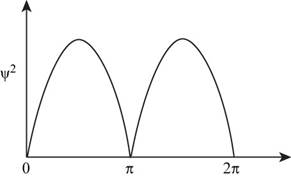
Given The wave function for the electron in one dimensional system is,
Ψ(x)=sinx
The probability density curve for the function Ψ2(x)=sin2x contains all the positive values of the given function over the whole range. Therefore, the probability density curve for the given function is,
Figure 1
(b)
Explanation:
Given The wave function for the electron in one dimensional system is,
Ψ(x)=sinx
The probability of finding electron for the given function is maximum on the values of x where the probability density curve has the maximum value. For the given function the value of sinx is maximum at the values x=π2 and x=3π2 . Therefore, the probability density curve for the given function has a peak at these values of x where probability of finding an electron is maximum.
(c)
Explanation: The wave function for the electron in one dimensional system is,
Ψ(x)=sinx
The probability of finding electron for the given function is minimum on the values of x where the probability density curve has the minimum value. For the given function the value of sinx is zero at the value of x=π . Therefore, the probability density curve for the given function has a node at this value of x where probability of finding electron is nil.
Conclusion:
(a) The probability density curve for the given function is as follows:
(b) The values of x is maximum at x=π2 and x=3π2 . (c) The probability of finding an electron at x=π is zero and this point is called node.
10.
Stereochemistry. Assign R/S stereochemistry for the chiral center indicated on the
following compound. In order to recieve full credit, you MUST SHOW YOUR WORK!
H₂N
CI
OH
CI
カー
11. () Stereochemistry. Draw all possible stereoisomers of the following compound. Assign
R/S configurations for all stereoisomers and indicate the relationship between each as
enantiomer, diastereomer, or meso.
NH2
H
HNH,
-18
b)
8.
Indicate whether the following carbocation rearrangements are likely to occur
Please explain your rational using 10 words or less
not likely to occur
• The double bond is still in the
Same position
+
Likely
to oc
occur
WHY?
-3
H3C
Brave
Chair Conformers. Draw the chair conformer of the following substituted
cyclohexane. Peform a RING FLIP and indicate the most stable
conformation and briefly explain why using 20 words or less.
CI
2
-cobs ??
MUST INDICATE H -2
-2
Br
EQ
Cl
OR
AT
Br
H&
most stable
WHY?
- 4
CH
12
Conformational Analysis. Draw all 6 conformers (one above each letter) of the
compound below looking down the indicated bond. Write the letter of the
conformer with the HIGHEST and LOWEST in energies on the lines provided.
NOTE: Conformer A MUST be the specific conformer of the structure as drawn below
-4 NOT
HOH
OH
3
Conformer A:
Br
OH
A
Samo
Br H
04
Br
H
H3
CH₂
H
anti
stagere
Br CH
clipsed
H
Brott
H
IV
H
MISSING 2
-2
B
C
D
E
F
X
6
Conformer with HIGHEST ENERGY:
13. (1
structure
LOWEST ENERGY:
Nomenclature. a) Give the systematic (IUPAC) name structure. b) Draw the
corresponding to this name. HINT: Do not forget to indicate stereochemistry
when applicable.
a)
८८
2
"Br
{t༐B,gt)-bemn€-nehpརི་ཚ༐lnoa
Parent name (noname)
4 Bromo
Sub = 2-methylethyl-4 Bromo nonane
b) (3R,4S)-3-chloro-4-ethyl-2,7-dimethyloctane
# -2
-2
Need a deep-dive on the concept behind this application? Look no further. Learn more about this topic, chemistry and related others by exploring similar questions and additional content below.
The Bohr Model of the atom and Atomic Emission Spectra: Atomic Structure tutorial | Crash Chemistry; Author: Crash Chemistry Academy;https://www.youtube.com/watch?v=apuWi_Fbtys;License: Standard YouTube License, CC-BY


 ChemistryChemistryISBN:9781305957404Author:Steven S. Zumdahl, Susan A. Zumdahl, Donald J. DeCostePublisher:Cengage Learning
 ChemistryChemistryISBN:9781259911156Author:Raymond Chang Dr., Jason Overby ProfessorPublisher:McGraw-Hill Education
 Principles of Instrumental AnalysisChemistryISBN:9781305577213Author:Douglas A. Skoog, F. James Holler, Stanley R. CrouchPublisher:Cengage Learning
 Organic ChemistryChemistryISBN:9780078021558Author:Janice Gorzynski Smith Dr.Publisher:McGraw-Hill Education
 Chemistry: Principles and ReactionsChemistryISBN:9781305079373Author:William L. Masterton, Cecile N. HurleyPublisher:Cengage Learning
 Elementary Principles of Chemical Processes, Bind...ChemistryISBN:9781118431221Author:Richard M. Felder, Ronald W. Rousseau, Lisa G. BullardPublisher:WILEY