Concept explainers
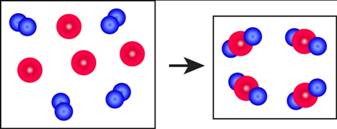
The reaction between reactant A (blue spheres) and reactant B (red spheres) is shown in the
following diagram

Based on this diagram, which equation best describes the reaction? [Section 3.1D
b.
c.
d.
To determine: The equation that best describes the reaction shown in the given diagram.
Answer to Problem 1E
Solution: The equation (a)
Explanation of Solution
Given
The reaction diagram,

Figure 1 The blue spheres represent the reactant
The red spheres represent the reactant
As depicted in the given diagram, A or blue spheres are present as diatomic molecules
4 molecules of A,
The reaction will be:
Taking coefficients common,
The equation that best describes the depicted chemical reaction is (a)
Want to see more full solutions like this?
Chapter 1 Solutions
Chemistry: The Central Science (13th Edition)
Additional Science Textbook Solutions
Chemistry: Structure and Properties (2nd Edition)
Microbiology: An Introduction
Biology: Life on Earth (11th Edition)
Campbell Biology: Concepts & Connections (9th Edition)
Chemistry: An Introduction to General, Organic, and Biological Chemistry (13th Edition)
The Cosmic Perspective (8th Edition)
- true or false The equilibrium constant for this reaction is 0.20. N2O4(g) ⇔ 2NO2(g) Based on the above, the equilibrium constant for the following reaction is 0.4. 2N2O4(g) ⇔ 4NO2(g)arrow_forwardtrue or false Using the following equilibrium, if heat is added the equilibrium will shift toward the reactants. N2(g) + 3H2(g) ⇔ 2NH3(g) + heatarrow_forwardTrue or False Using the following equilibrium, if heat is added the equilibrium will shift toward the products. N2O4(g) + heat ⇔ 2NO2(g)arrow_forward
- true or false Using the following equilibrium, if solid carbon is added the equilibrium will shift toward the products. C(s) + CO2(g) ⇔ 2CO(g)arrow_forwardProvide the complete mechanism for the reaction below. You must include appropriate arrows,intermediates, and formal charges. Please also provide a reason to explain why the 1,4-adduct is preferred over the 1,3-adduct.arrow_forwardWhich of the following pairs are resonance structures of one another? I. III. || III IV + II. :0: n P !༠ IV. EN: Narrow_forward
- Predict the major organic product(s) and byproducts (either organic or inorganic) for thefollowing reactions.arrow_forwardA 8.25 g sample of aluminum at 55°C released 2500 J of heat. The specific heat of aluminum is 0.900 J/g°C. The density of aluminum is 2.70 g/mL. Calculate the final temperature of the aluminum sample in °C.arrow_forwardPredict the major organic product(s) and byproducts (either organic or inorganic) for thefollowing reactions.arrow_forward
- Predict the major organic product(s) and byproducts (either organic or inorganic) for thefollowing reaction.arrow_forwardplease helparrow_forwardExperiment 1 Data Table 1: Conservation of Mass - Initial Mass Data Table 1 Data Table 2 Data Table 3 Data Table 4 Panel 1 Photo 1 Data Table 5 Reaction Mass of test tube and 5.0% HC₂H₂O2 (g) # (A) (B) Mass of NaHCO, (g) Mass of balloon and NaHCO, (g) (C) 0.10 1 0829 14.38g 0.20 2 0.929 14.29g 0.35 1.00g 3 14.25g 0.50 1.14g 14.29 Experiment 1 Data Table 2: Moles of HC2H3O2 Reaction Volume of Mass of Moles of HC₂H₂O₂ 5.0% Vinegar (g) (ML) 5.0 0.25 0042 mol 2 5.0 0.25 0042 mol 3 5.0 0.25 0042 mol 5.0 0.25 0042 mol Experiment 1 Data Table 3: Moles of NaHCO3 Reaction Mass of NaHCO (g) 10g 20g 35g 50g Experiment 1 Data Table 4: Theoretical Yield of CO₂ Reaction # 1 2 3 Experiment 1 Total mass before reaction (g) (D=A+C) 15.29 15.21g 15.25g 15.349 Exercise 1 Data Table 1 Data Table 2 Data Table 3 Data Table 4 Panel 1 Photo 1 Data Table 5 Exercise 1- Data Table 1 Data Table 2 DataTable 3 Data Table 4 Panel 1 Photo 1 Data Table 5 Exercise 1- Moles of NaHCO 0012 mol 0025 mol 0044 mol 0062 mol…arrow_forward
 ChemistryChemistryISBN:9781305957404Author:Steven S. Zumdahl, Susan A. Zumdahl, Donald J. DeCostePublisher:Cengage Learning
 Chemistry: An Atoms First ApproachChemistryISBN:9781305079243Author:Steven S. Zumdahl, Susan A. ZumdahlPublisher:Cengage Learning
 Chemistry for Engineering StudentsChemistryISBN:9781337398909Author:Lawrence S. Brown, Tom HolmePublisher:Cengage Learning
 Chemistry: The Molecular ScienceChemistryISBN:9781285199047Author:John W. Moore, Conrad L. StanitskiPublisher:Cengage Learning


