
Videos
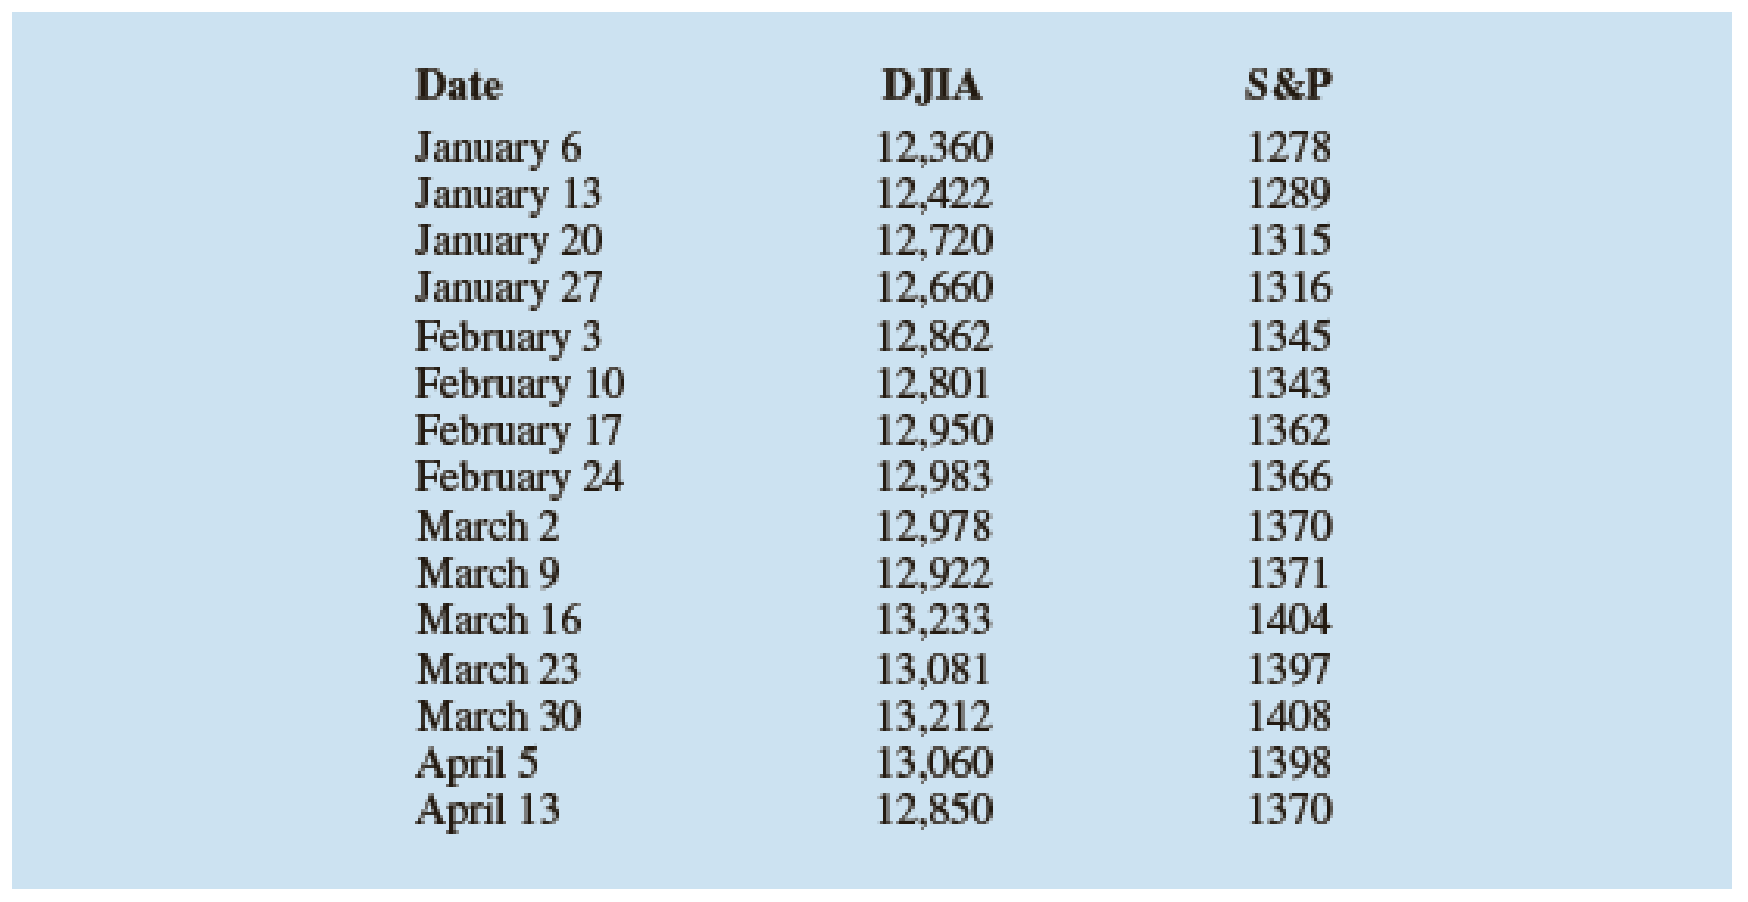
The Dow Jones Industrial Average (DJIA) and the Standard & Poor’s 500 (S&P 500) indexes are used as measures of overall movement in the stock market. The DJIA is based on the price movements of 30 large companies; the S&P 500 is an index composed of 500 stocks. Some say the S&P 500 is a better measure of stock market performance because it is broader based. The closing price for the DJIA and the S&P 500 for 15 weeks, beginning with January 6, 2012, follow (Barron’s website, April 17, 2012).
- a. Develop a
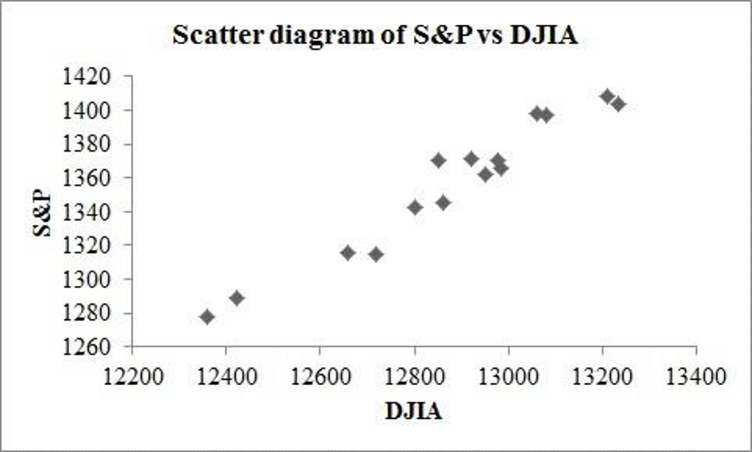
scatter diagram with DJIA as the independent variable. - b. Develop the estimated regression equation.
- c. Test for a significant relationship. Use α = .05.
- d. Did the estimated regression equation provide a good fit? Explain.
- e. Suppose that the closing price for the DJIA is 13,500. Predict the closing price for the S&P 500.
- f. Should we be concerned that the DJIA value of 13,500 used to predict the S&P 500 value in part (e) is beyond the
range of the data used to develop the estimated regression equation?
a.
Draw a scatter diagram with DIJA as the independent variable.
Answer to Problem 55SE
The scatter diagram is obtained as follows:
Explanation of Solution
Calculation:
The data shows the closing price for the DIJA and S&P 500 for 15 weeks, beginning with Jan 6, 2012.
Software procedure:
Step-by-step software procedure to draw the scatter diagram using EXCEL:
- Open an EXCEL file.
- In column A enter the data of DJIA and in column B enter the corresponding values of S&P.
- Select the data that is to be displayed.
- Click on the Insert Tab > select Scatter icon.
- Choose a Scatter with only Markers.
- Click on the chart > select Layout from the Chart Tools.
- Select Axis Title > Primary Horizontal Axis Title > Title Below Axis.
- Enter DJIA in the dialog box
- Select Axis Title > Primary Vertical Axis Title > Rotated Title.
- Enter S&P in the dialog box.
b.
Find the estimated regression equation.
Answer to Problem 55SE
The estimated regression equation is
Explanation of Solution
Calculation:
The estimated regression equation is to be obtained.
Software procedure:
Step-by-step procedure to obtain the estimated regression equation using Excel:
- In Excel sheet, enter S&P and DJIA in different columns.
- In Data, select Data Analysis and choose Regression.
- In Input Y Range, select S&P.
- In Input X Range, select DJIA.
- Select Labels.
- Click OK.
Output obtained using Excel is given below:
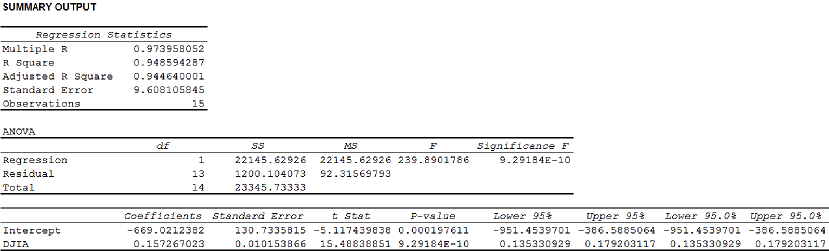
Thus, the estimated regression equation is
c.
Test for a significant relationship at
Answer to Problem 55SE
There is a significant relationship between S&P and DJIA.
Explanation of Solution
Calculation:
Consider that
State the test hypotheses.
Null hypothesis:
That is, there is no significant relationship between S&P and DJIA.
Alternative hypothesis:
That is, there is a significant relationship between S&P and DJIA.
From the output in pat (b) it is found that the F-test statistic is 239.89.
Level of significance:
The given level of significance is
p-value:
From the output in Pat (b), it is found that the p-value is 0.
Rejection rule:
If
Conclusion:
Here, the p-value is less than the level of significance.
That is,
Thus, the decision is “reject the null hypothesis”.
Therefore, the data provides sufficient evidence to conclude that there is a significant relationship between S&P and DJIA.
Thus, S&P and DJIA are related.
d.
Explain whether the estimated regression provides a good fit.
Answer to Problem 55SE
The model provides a good fit.
Explanation of Solution
Calculation:
The coefficient of determination (
In the given output in Part (b),
Thus, the percentage of variation in the observed values of S&P 500 is explained by the regression is 94.86%, which indicates that 94.86% of the variability in S&P 500 is explained by the variability in DJIP using linear regression model.
Thus, the model provides a good fit.
e.
Predict the closing price for the S&P 500.
Answer to Problem 55SE
The predicted closing price for the S&P 500 is 1,454.
Explanation of Solution
Calculation:
The closing price for the DJIA is 13,500.
Using the estimated regression equation
Thus, the predicted closing price for the S&P 500 is 1,454.
f.
Explain whether it is concerned that the DJIA is 13,500 used to predict the S&P 500 value in Part (e) is beyond the range of the data used to develop the estimated regression equation.
Explanation of Solution
From Part (e), it is found that the predicted closing price for the S&P 500 is 1,454.
According to the scatter diagram or given data, it can be said that the predicted DJIA is not far beyond the range of the data. Thus, there should not be too concern about using the estimated regression equation to predict S&P 500.
Want to see more full solutions like this?
Chapter 14 Solutions
Modern Business Statistics with Microsoft Office Excel (with XLSTAT Education Edition Printed Access Card) (MindTap Course List)


- A company found that the daily sales revenue of its flagship product follows a normal distribution with a mean of $4500 and a standard deviation of $450. The company defines a "high-sales day" that is, any day with sales exceeding $4800. please provide a step by step on how to get the answers in excel Q: What percentage of days can the company expect to have "high-sales days" or sales greater than $4800? Q: What is the sales revenue threshold for the bottom 10% of days? (please note that 10% refers to the probability/area under bell curve towards the lower tail of bell curve) Provide answers in the yellow cellsarrow_forwardFind the critical value for a left-tailed test using the F distribution with a 0.025, degrees of freedom in the numerator=12, and degrees of freedom in the denominator = 50. A portion of the table of critical values of the F-distribution is provided. Click the icon to view the partial table of critical values of the F-distribution. What is the critical value? (Round to two decimal places as needed.)arrow_forwardA retail store manager claims that the average daily sales of the store are $1,500. You aim to test whether the actual average daily sales differ significantly from this claimed value. You can provide your answer by inserting a text box and the answer must include: Null hypothesis, Alternative hypothesis, Show answer (output table/summary table), and Conclusion based on the P value. Showing the calculation is a must. If calculation is missing,so please provide a step by step on the answers Numerical answers in the yellow cellsarrow_forward
 Glencoe Algebra 1, Student Edition, 9780079039897...AlgebraISBN:9780079039897Author:CarterPublisher:McGraw Hill
 Holt Mcdougal Larson Pre-algebra: Student Edition...AlgebraISBN:9780547587776Author:HOLT MCDOUGALPublisher:HOLT MCDOUGAL
 Big Ideas Math A Bridge To Success Algebra 1: Stu...AlgebraISBN:9781680331141Author:HOUGHTON MIFFLIN HARCOURTPublisher:Houghton Mifflin Harcourt
 College Algebra (MindTap Course List)AlgebraISBN:9781305652231Author:R. David Gustafson, Jeff HughesPublisher:Cengage Learning