Concept explainers
Videos
What Is Static Equilibrium?
Problems 1–3 are grouped.
1. C A ball is attached to a strong, lightweight rod (Fig. P14.1). The rod is supported by a horizontal pin near the top. The ball is at rest. Is the ball in static equilibrium? If not, why not? If so, which type of equilibrium is it—stable, unstable, or neutral? Hint: What would happen if you displaced the ball slightly?
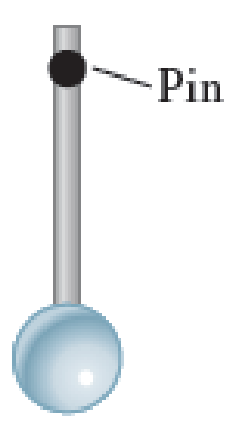
FIGURE P14.1
Whether the ball is in static equilibrium and if so the type of equilibrium in which the ball is present.
Answer to Problem 1PQ
The ball is in static equilibrium and it is stable equilibrium.
Explanation of Solution
Equilibrium is a special case of motion in which an object’s translational momentum and angular momentum are both constant. Static equilibrium is a special case in which the object’s translational momentum and angular momentum are zero. This also implies that for an object to be in static equilibrium, the total force and the total torque acting on the object must be zero. There are three types of static equilibrium namely stable static equilibrium, unstable static equilibrium and neutral static equilibrium. If an object returns to its equilibrium position after being released, it will be in stable equilibrium. If an object moves farther away from the equilibrium position after being released, it will be in unstable equilibrium. If an object is moved and released from a new position and does not move toward or away from its equilibrium position, then the object is in neutral equilibrium.
It is given that the ball in the figure is at rest so that it has no acceleration. This implies the net force and the torque acting on the ball are zero and the ball must be in static equilibrium. If the ball is displaced slightly, it will return to or pass through the equilibrium position. According to the definition, it is stable equilibrium.
Conclusion:
Thus, the ball is in stable static equilibrium since the net force and the torque acting on it is zero and it returns to its equilibrium position when it is displaced slightly.
Want to see more full solutions like this?
Chapter 14 Solutions
Physics for Scientists and Engineers: Foundations and Connections


- = Portfolio Problem 1. A particle of mass m is dropped (i.e., falls down with zero initial velocity) at time t 0 from height h. If the particle is subject to gravitational acceleration only, i.e., a = −gk, determine its speed as it hits the ground by solving explicitly the expressions for its velocity and position. Next, verify your result using dimensional analysis, assuming that the general relation is of the form v = khag³m, where k is a dimensionless constant.arrow_forwardReview Conceptual Example 2 before attempting this problem. Two slits are 0.158 mm apart. A mixture of red light (wavelength = 693 nm) and yellow-green light (wavelength = 567 nm) falls on the slits. A flat observation screen is located 2.42 m away. What is the distance on the screen between the third-order red fringe and the third-order yellow- green fringe? m = 3 m = 3 m= 0 m = 3 m = 3 Fringes on observation screenarrow_forwardIn the figure below, a semicircular conductor of radius R = 0.260 m is rotated about the axis AC at a constant rate of 130 rev/min. A uniform magnetic field of magnitude 1.22 T fills the entire region below the axis and is directed out of the page. In this illustration, a wire extends straight to the right from point A, then curves up and around in a semicircle of radius R. On the right side of the semicircle, the wire continues straight to the right to point C. The wire lies in the plane of the page, in a region of no magnetic field. Directly below the axis A C is a region of uniform magnetic field pointing out of the page, vector Bout. If viewed from the right, the wire can rotate counterclockwise, so that the semicircular part can rotate into the region of magnetic field. (a) Calculate the maximum value of the emf induced between the ends of the conductor. V(b) What is the value of the average induced emf for each complete rotation? Consider carefully whether the correct answer is…arrow_forward
- A coil of 15 turns and radius 10.0 cm surrounds a long solenoid of radius 2.20 cm and 1.00 103 turns/meter (see figure below). The current in the solenoid changes as I = 6.00 sin(120t), where I is in amperes and t is in seconds. Find the induced emf (in volts) in the 15-turn coil as a function of time. (Do not include units in your answer.) =arrow_forwardA coil of 15 turns and radius 10.0 cm surrounds a long solenoid of radius 1.80 cm and 1.00 103 turns/meter (see figure below). The current in the solenoid changes as I = 5.00 sin(120t), where I is in amperes and t is in seconds. Find the induced emf (in volts) in the 15-turn coil as a function of time. (Do not include units in your answer.) =arrow_forwardWhich vowel does this graph represent (”ah,” “ee,” or “oo”)? How can you tell? Also, how would you be able to tell for the other vowels?arrow_forward
- Concept Simulation 26.4 provides the option of exploring the ray diagram that applies to this problem. The distance between an object and its image formed by a diverging lens is 5.90 cm. The focal length of the lens is -2.60 cm. Find (a) the image distance and (b) the object distance.arrow_forwardA bat is flying toward a cave wall at 27.0 m/s. What is the frequency of the reflected sound that it hears, assuming it emits sound at 52.0 kHz? The speed of sound is 341.5 m/s. Multiple Choice о 60.9 kHz О 56.5 kHz о 61.3 kHz О 56.1 kHzarrow_forwardCompare the slope of your Data Table 2 graph to the average wavelength (Ave, l) from Data Table 2 by calculating the % Difference. Is the % Difference calculated for the wavelength in Data Table 2 within an acceptable % error? Explain why or why not?arrow_forward
- The slope of a graph of velocity, v, vs frequency, f, is equal to wavelength, l. Compare the slope of your Data Table 1 graph to the average wavelength (Ave, l) from Data Table 1 by calculating the % Difference.arrow_forwardExamine the slope of the line on the graph created using the data in Data Table 4 of Period, T2 vs L, the slope of the line is a constant containing the acceleration due to gravity, g. Using the slope of your line, determine the experimental value for g. Compare the value you determined for g from the slope of the graph to the expected value of 9.81 m/s2 by calculating the percent error.arrow_forwardFrom your examination of the graph created using the data in Data Table 4 of Period, T vs √L . What would you determine is the relationship between the period of a pendulum and the length of a pendulum?arrow_forward
 Physics for Scientists and Engineers: Foundations...PhysicsISBN:9781133939146Author:Katz, Debora M.Publisher:Cengage Learning
 Physics for Scientists and EngineersPhysicsISBN:9781337553278Author:Raymond A. Serway, John W. JewettPublisher:Cengage Learning
 Physics for Scientists and Engineers with Modern ...PhysicsISBN:9781337553292Author:Raymond A. Serway, John W. JewettPublisher:Cengage Learning
 College PhysicsPhysicsISBN:9781305952300Author:Raymond A. Serway, Chris VuillePublisher:Cengage Learning
 University Physics Volume 1PhysicsISBN:9781938168277Author:William Moebs, Samuel J. Ling, Jeff SannyPublisher:OpenStax - Rice University
 Principles of Physics: A Calculus-Based TextPhysicsISBN:9781133104261Author:Raymond A. Serway, John W. JewettPublisher:Cengage Learning