
Concept explainers
Interpretation:
The product should be identified from given alcohol.
Concept introduction:
Dehydration reaction:
Removal of water molecule from the reaction when the alcohol is treated with strong acid like sulfuric acid.

Alcohol is reaction with concentrated sulfuric acid, first alcohol gets protonated forms carbocation (more stable carbocation) followed by elimination of proton (
Tertiary carbocation is more stable than the secondary, secondary carbocation is more stable than primary.
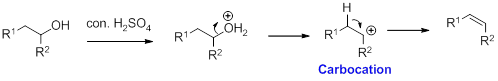
In dehydration reaction, sulfuric acid is act as a proton donor, and which is used to protonate the alcohol and makes carbocation therefore sulfuric acid is the driving force of the reaction.
Want to see the full answer?
Check out a sample textbook solution
Chapter 14 Solutions
Fundamentals of General, Organic, and Biological Chemistry, Books a la Carte Plus Mastering Chemistry with Pearson eText -- Access Card Package (8th Edition)


- Balance the following equation and list of coefficients in order from left to right. SF4+H2O+—-> H2SO3+HFarrow_forwardProblem 15 of 15 Submit Using the following reaction data points, construct Lineweaver-Burk plots for an enzyme with and without an inhibitor by dragging the points to their relevant coordinates on the graph and drawing a line of best fit. Using the information from this plot, determine the type of inhibitor present. 1 mM-1 1 s mM -1 [S]' V' with 10 μg per 20 54 10 36 20 5 27 2.5 23 1.25 20 Answer: |||arrow_forward12:33 CO Problem 4 of 15 4G 54% Done On the following Lineweaver-Burk -1 plot, identify the by dragging the Km point to the appropriate value. 1/V 40 35- 30- 25 20 15 10- T Км -15 10 -5 0 5 ||| 10 15 №20 25 25 30 1/[S] Г powered by desmosarrow_forward
- 1:30 5G 47% Problem 10 of 15 Submit Using the following reaction data points, construct a Lineweaver-Burk plot for an enzyme with and without a competitive inhibitor by dragging the points to their relevant coordinates on the graph and drawing a line of best fit. 1 -1 1 mM [S]' s mM¹ with 10 mg pe 20 V' 54 10 36 > ст 5 27 2.5 23 1.25 20 Answer: |||arrow_forwardProblem 14 of 15 Submit Using the following reaction data points, construct Lineweaver-Burk plots for an enzyme with and without an inhibitor by dragging the points to their relevant coordinates on the graph and drawing a line of best fit. Using the information from this plot, determine the type of inhibitor present. 1 mM-1 1 s mM -1 [S]' V' with 10 μg per 20 54 10 36 20 5 27 2.5 23 1.25 20 Answer: |||arrow_forward12:36 CO Problem 9 of 15 4G. 53% Submit Using the following reaction data points, construct a Lineweaver-Burk plot by dragging the points to their relevant coordinates on the graph and drawing a line of best fit. Based on the plot, determine the value of the catalytic efficiency (specificity constant) given that the enzyme concentration in this experiment is 5.0 μ.Μ. 1 [S] ¨‚ μM-1 1 V sμM-1 100.0 0.100 75.0 0.080 50.0 0.060 15.0 0.030 10.0 0.025 5.0 0.020 Answer: ||| O Гarrow_forward
- Problem 11 of 15 Submit Using the following reaction data points, construct a Lineweaver-Burk plot for an enzyme with and without a noncompetitive inhibitor by dragging the points to their relevant coordinates on the graph and drawing a line of best fit. 1 -1 1 mM [S]' 20 V' s mM¹ with 10 μg per 54 10 36 > ст 5 27 2.5 23 1.25 20 Answer: |||arrow_forwardProblem 13 of 15 Submit Using the following reaction data points, construct Lineweaver-Burk plots for an enzyme with and without an inhibitor by dragging the points to their relevant coordinates on the graph and drawing a line of best fit. Using the information from this plot, determine the type of inhibitor present. 1 mM-1 1 s mM -1 [S]' V' with 10 μg per 20 54 10 36 20 5 27 2.5 23 1.25 20 Answer: |||arrow_forward12:33 CO Problem 8 of 15 4G. 53% Submit Using the following reaction data points, construct a Lineweaver-Burk plot by dragging the points to their relevant coordinates on the graph and drawing a line of best fit. Based on the plot, determine the value of kcat given that the enzyme concentration in this experiment is 5.0 μM. 1 [S] , мм -1 1 V₁ s μM 1 100.0 0.100 75.0 0.080 50.0 0.060 15.0 0.030 10.0 0.025 5.0 0.020 Answer: ||| Гarrow_forward

 Principles Of Radiographic Imaging: An Art And A ...Health & NutritionISBN:9781337711067Author:Richard R. Carlton, Arlene M. Adler, Vesna BalacPublisher:Cengage Learning
 Human Physiology: From Cells to Systems (MindTap ...BiologyISBN:9781285866932Author:Lauralee SherwoodPublisher:Cengage Learning
 Anatomy & PhysiologyBiologyISBN:9781938168130Author:Kelly A. Young, James A. Wise, Peter DeSaix, Dean H. Kruse, Brandon Poe, Eddie Johnson, Jody E. Johnson, Oksana Korol, J. Gordon Betts, Mark WomblePublisher:OpenStax College