Concept explainers
Videos
a.
Find the sum of each roll.
a.
Answer to Problem 19PPS
Explanation of Solution
Given information:
Investigate expected value,

Roll two dice
Calculation:
Table shows the sum of
b.
Find the
b.
Answer to Problem 19PPS
Explanation of Solution
Given information:
Investigate expected value,

Roll two dice
Calculation:
Table shows the
c.
Complete the table from the result of part
c.
Answer to Problem 19PPS
Explanation of Solution
Given information:
Investigate expected value,

Roll two dice
Calculation:
Table shows the result of part
d.
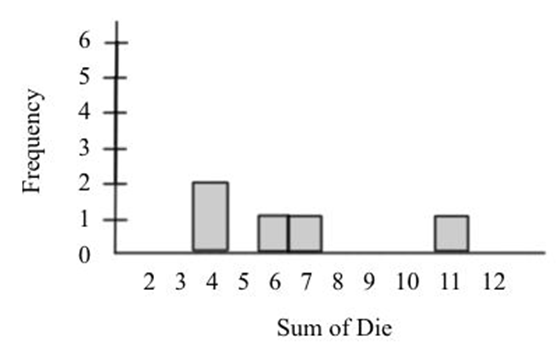
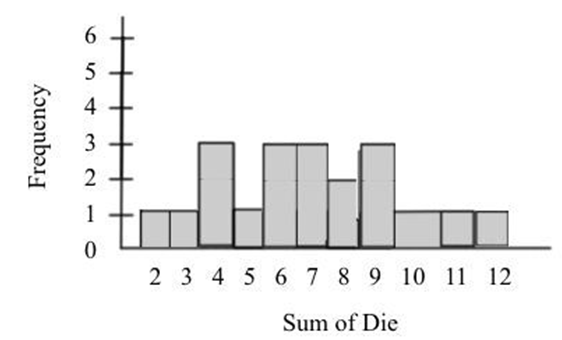
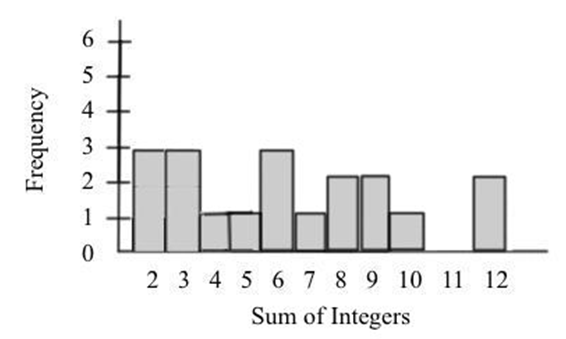
Use a bar graph the number of times each possible sum occurred in the first
d.
Answer to Problem 19PPS

Explanation of Solution
Given information:
Investigate expected value,

Repeat the process for the first
Calculation:
The bar graph shows the number of times each possible sum occurred in first

The bar graph shows the number of times each possible sum occurred in first
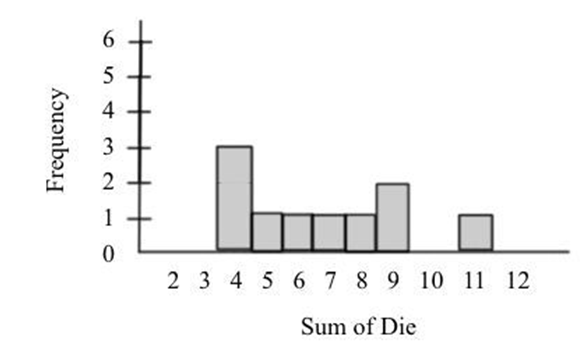
The bar graph shows the number of times each possible sum occurred in first

e.
Identify the shape of a bar graph changes after each additional trial.
e.
Answer to Problem 19PPS
The bar graph has more data points in the middle.
Explanation of Solution
Given information:
Investigate expected value,

Calculation:
As the trial is added each possible sum occurred in the first
The bar graph has more data points in the middle.
f.
Graph the number of times each possible sum occurred with the random number generator as a bar graph.
f.
Answer to Problem 19PPS
Explanation of Solution
Given information:
Investigate expected value,

Calculation:
Graph the number of times each possible sum occurred in the

g.
Compare the die trial and random trial graphs.
g.
Answer to Problem 19PPS
Both the graphs are almost similar.
Explanation of Solution
Given information:
Investigate expected value,
Calculation:
Both the graphs are almost similar. Both have most data point at the middle.
h.
Find excepted value based on the graphs.
h.
Answer to Problem 19PPS
The expected value from both the experiment is the same
Explanation of Solution
Given information:
Investigate expected value,

Calculation:
The expected value from both the experiment is the same.
Chapter 13 Solutions
Geometry, Student Edition
Additional Math Textbook Solutions
Thinking Mathematically (6th Edition)
Calculus: Early Transcendentals (2nd Edition)
University Calculus: Early Transcendentals (4th Edition)
Algebra and Trigonometry (6th Edition)
Elementary Statistics: Picturing the World (7th Edition)


- Can someone help me with this please?arrow_forwardMariela is in her classroom and looking out of a window at a tree, which is 20 feet away. Mariela’s line of sight to the top of the tree creates a 42° angle of elevation, and her line of sight to the base of the tree creates a 31° angle of depression. What is the height of the tree, rounded to the nearest foot? Be sure to show your work to explain how you got your answer.arrow_forward1arrow_forward
 Elementary Geometry For College Students, 7eGeometryISBN:9781337614085Author:Alexander, Daniel C.; Koeberlein, Geralyn M.Publisher:Cengage,
 Elementary Geometry for College StudentsGeometryISBN:9781285195698Author:Daniel C. Alexander, Geralyn M. KoeberleinPublisher:Cengage Learning