To calculate:
The probability of given event.
Answer to Problem 11PPS
The probability that a car sold is of color
Explanation of Solution
Given information:
Event:
A car dealerships analysis insicated that
Calculation:
The following table represents the percentage of colors of cars sold at a dealership.
| Color | Percentage of Tickets |
To simulate car color sales, use a random number generator to generate integers from
Generate
Now let integers
Record the frequency of observed outcomes. The frequency of observed outcomes. The frequency of outcomes will vary between sets of
One such set of spins can be recorded in a frequency table as follows:
| Outcome | Frequency |
| Total |
Now, divide each frequency in the frequency table to get the probabilities for each outcome.
| Outcome | Frequency | Probability |
| Total |
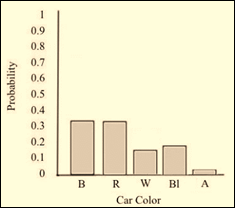
Make a probability histogram by charting probability on the vertical axis and outcomes on the horizontal axis.

Therefore, based on the simulation, the probability that a car sold is of color
Chapter 13 Solutions
Geometry, Student Edition
Additional Math Textbook Solutions
Introductory Statistics
Calculus: Early Transcendentals (2nd Edition)
Basic Business Statistics, Student Value Edition
A First Course in Probability (10th Edition)
University Calculus: Early Transcendentals (4th Edition)
- Door 87.5in to 47 living 44.75 Closet 96in Window ISS.Sin 48in Train Table 96in 48in 132:2 Windowarrow_forward39 Two sides of one triangle are congruent to two sides of a second triangle, and the included angles are supplementary. The area of one triangle is 41. Can the area of the second triangle be found?arrow_forwardA parallelogram with an area of 211.41 m^2 hast a base Thatcher measures 24.3m. Find ist height.arrow_forward
 Elementary Geometry For College Students, 7eGeometryISBN:9781337614085Author:Alexander, Daniel C.; Koeberlein, Geralyn M.Publisher:Cengage,
 Elementary Geometry for College StudentsGeometryISBN:9781285195698Author:Daniel C. Alexander, Geralyn M. KoeberleinPublisher:Cengage Learning

