
Concept explainers
Videos
Does more education cause more crime? The FL Crime data file on the book’s website has data for the 67 counties in Florida on
y = crime rate: Annual number of crimes in county per 1000 population
x1 = education: Percentage of adults in county with at least a high school education
x2 = urbanization: Percentage in county living in an urban environment.
The figure shows a
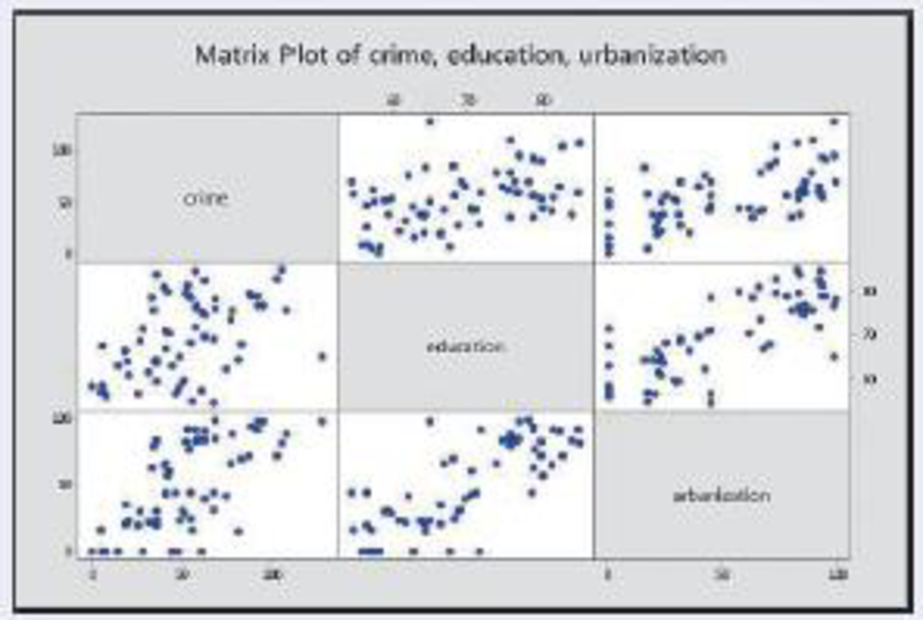
Scatterplot matrix for crime rate, education, and urbanization.
Multiple regression for y = crime rate, x1 = education, and x2 = urbanization.
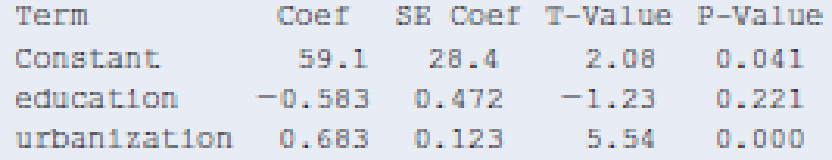
- a. Find the predicted crime rate for a county that has 0% in an urban environment and (i) 70% high school graduation rate and (ii) 80% high school graduation rate.
- b. Use results from part a to explain how education affects the crime rate, controlling for urbanization, interpreting the slope coefficient −0.58 of education.
- c. Using the prediction equation, show that the equation relating crime rate and education when urbanization is fixed at (i) 0, (ii) 50, and (iii) 100, is as follows:
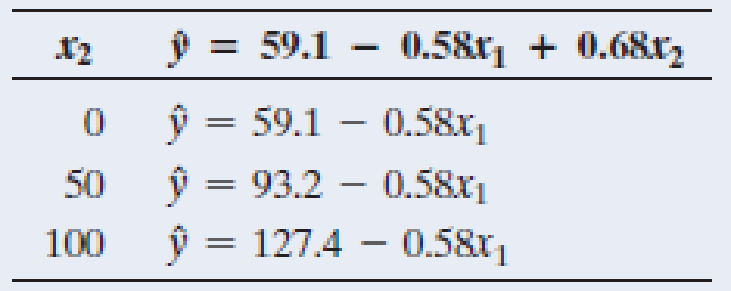
Sketch a plot with these lines and use it to interpret the effect of education on crime rate, controlling for urbanization.
- d. The scatterplot matrix shows that education has a positive association with crime rate, but the multiple regression equation shows that the association is negative when we keep x2 = urbanization fixed. Consider the hypothetical figure that follows. Sketch lines that represent (i) the prediction equation from a simple regression model using only education and ignoring the information on urbanization and (ii) the prediction equation from the multiple regression model for counties having urbanization = 50. Use these lines to explain the difference in the interpretation of the slope for education in simple and multiple regression models with regard to ignoring or controlling for urbanization. (Note: The reversal in the association between crime rate and education is an example of Simpson’s paradox; see Example 16 in Sec. 3.4 and Example 18 in Sec. 10.5).
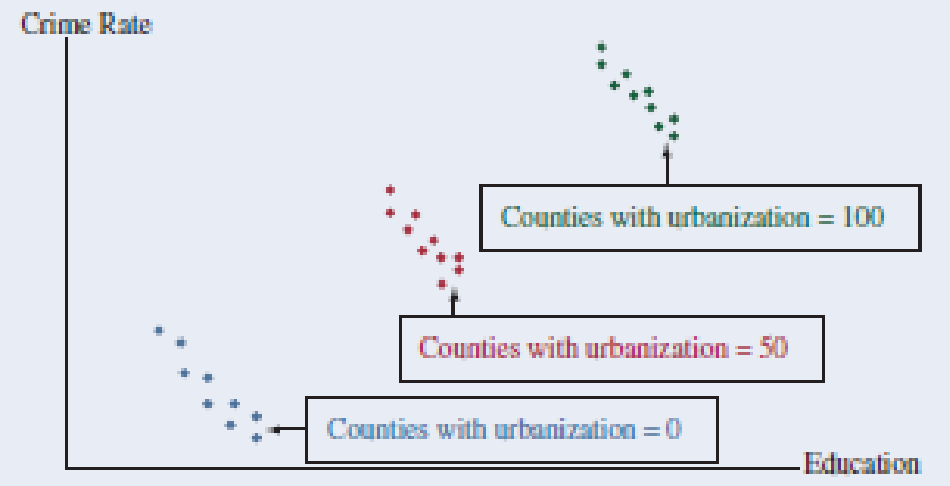
Hypothetical scatterplot for crime rate and education, labeling by urbanization.
Want to see the full answer?
Check out a sample textbook solution
Chapter 13 Solutions
Statistics: The Art and Science of Learning from Data (4th Edition)


 Glencoe Algebra 1, Student Edition, 9780079039897...AlgebraISBN:9780079039897Author:CarterPublisher:McGraw Hill
 Big Ideas Math A Bridge To Success Algebra 1: Stu...AlgebraISBN:9781680331141Author:HOUGHTON MIFFLIN HARCOURTPublisher:Houghton Mifflin Harcourt
 Linear Algebra: A Modern IntroductionAlgebraISBN:9781285463247Author:David PoolePublisher:Cengage Learning
 Functions and Change: A Modeling Approach to Coll...AlgebraISBN:9781337111348Author:Bruce Crauder, Benny Evans, Alan NoellPublisher:Cengage Learning
 Holt Mcdougal Larson Pre-algebra: Student Edition...AlgebraISBN:9780547587776Author:HOLT MCDOUGALPublisher:HOLT MCDOUGAL