
Videos
To find: the measurement of central tendency would the museum, and to show it has a large number of visitors.
Answer to Problem 10PPS
Mode value of the data will be 214.
Median value will be 217.
Mean visitors to the museum are 223.
Explanation of Solution
Given information:
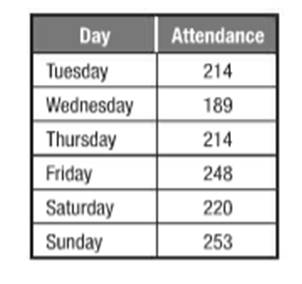
The table shows the attendance at an art museum.
Calculation:
Consider the number of visitors at the museum from Tuesday to Sunday mentioned below.
214, 189, 214, 248, 220, 253
Let’s arrange the data first in ascending order to calculate the central tendencies.
189, 214, 220, 220, 248, 253
Calculate the Mean, Median and Mode of the data values.
Mean visitors to the museum are 223.
As we know Median is the middle value of data sorted from least to greatest.
There is an even number of observations in the data, so mean of middle values will be the median.
Hence median value will be 217.
Mode occurs the most in the data.
Since 214 occurs twice in the dataset, hence mode value of the data will be 214.
Chapter 13 Solutions
Pre-Algebra Student Edition
Additional Math Textbook Solutions
Calculus: Early Transcendentals (2nd Edition)
Algebra and Trigonometry (6th Edition)
Thinking Mathematically (6th Edition)
Elementary Statistics (13th Edition)


- please Solve questions by Course Name( Ordinary Differential Equations II 2)arrow_forwardInThe Northern Lights are bright flashes of colored light between 50 and 200 miles above Earth. Suppose a flash occurs 150 miles above Earth. What is the measure of arc BD, the portion of Earth from which the flash is visible? (Earth’s radius is approximately 4000 miles.)arrow_forwarde). n! (n - 1)!arrow_forward
- Suppose you flip a fair two-sided coin four times and record the result. a). List the sample space of this experiment. That is, list all possible outcomes that could occur when flipping a fair two-sided coin four total times. Assume the two sides of the coin are Heads (H) and Tails (T).arrow_forwarde). n! (n - 1)!arrow_forwardEvaluate the following expression and show your work to support your calculations. a). 6! b). 4! 3!0! 7! c). 5!2! d). 5!2! e). n! (n - 1)!arrow_forward
- Amy and Samiha have a hat that contains two playing cards, one ace and one king. They are playing a game where they randomly pick a card out of the hat four times, with replacement. Amy thinks that the probability of getting exactly two aces in four picks is equal to the probability of not getting exactly two aces in four picks. Samiha disagrees. She thinks that the probability of not getting exactly two aces is greater. The sample space of possible outcomes is listed below. A represents an ace, and K represents a king. Who is correct?arrow_forwardConsider the exponential function f(x) = 12x. Complete the sentences about the key features of the graph. The domain is all real numbers. The range is y> 0. The equation of the asymptote is y = 0 The y-intercept is 1arrow_forwardThe graph shows Alex's distance from home after biking for x hours. What is the average rate of change from -1 to 1 for the function? 4-2 о A. -2 О B. 2 О C. 1 O D. -1 ty 6 4 2 2 0 X 2 4arrow_forward
 Algebra and Trigonometry (6th Edition)AlgebraISBN:9780134463216Author:Robert F. BlitzerPublisher:PEARSON
 Contemporary Abstract AlgebraAlgebraISBN:9781305657960Author:Joseph GallianPublisher:Cengage Learning
 Linear Algebra: A Modern IntroductionAlgebraISBN:9781285463247Author:David PoolePublisher:Cengage Learning
 Algebra And Trigonometry (11th Edition)AlgebraISBN:9780135163078Author:Michael SullivanPublisher:PEARSON
 Introduction to Linear Algebra, Fifth EditionAlgebraISBN:9780980232776Author:Gilbert StrangPublisher:Wellesley-Cambridge Press
 College Algebra (Collegiate Math)AlgebraISBN:9780077836344Author:Julie Miller, Donna GerkenPublisher:McGraw-Hill Education