Concept explainers
a.
To calculate: The probability that the outcome will be between $16,800 and $31,200.
Introduction:
Probability:
The likelihood of the occurrence of an event or of a proposition to be true, when expressed numerically or quantitatively, is termed as probability.
a.
Answer to Problem 20P
The probability that the outcome will be between $16,800 and $31,200 is 0.8664.
Explanation of Solution
The calculation of the expected value (Z) for the outcome being equal to or greater than $16,800 is shown below.
The calculation of the expected value (Z) for the outcome being equal to or lower than $31,200 is shown below.
The Z values are positive as well as negative 1.5. Hence, the probability of the outcome being between $16,800 and $31,200 is 0.8664.
b.
To calculate: The probability that the outcome will be between $14,400 and $33,600.
Introduction:
Probability:
The likelihood of the occurrence of an event or of a proposition to be true, when expressed numerically or quantitatively, is termed as probability.
b.
Answer to Problem 20P
The probability that the outcome will be between $14,400 and $33,600 is 0.9544.
Explanation of Solution
The calculation of the expected value (Z) for the outcome being equal to or greater than $14,400 is shown below.
The calculation of the expected value (Z) for the outcome being equal to or lower than $33,600 is shown below.
The Z values are positive as well as negative 2. Hence, the probability of the outcome being between $14,400 and $33,600 is 0.9544.
c.
To calculate: The probability that the outcome will be at least $14,400.
Introduction:
Probability:
The likelihood of the occurrence of an event or of a proposition to be true, when expressed numerically or quantitatively, is termed as probability.
c.
Answer to Problem 20P
The probability that the outcome will be at least $14,400 is 0.9544.
Explanation of Solution
The calculation of the expected value (Z) for the outcome being at least $14,400 is shown below.
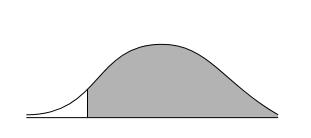
The expected value is 0.4772 when Z is (+ or -) 2 and 0.5000 when Z is 0. So, the probability of the outcome being at least $14,400 is 0.9772. The graph of this probability is shown below.

d.
To calculate: The probability that the outcome will be less than $31,900.
Introduction:
Probability:
The likelihood of the occurrence of an event or of a proposition to be true, when expressed numerically or quantitatively, is termed as probability.
d.
Answer to Problem 20P
The probability that the outcome will be less than $31,900 is 0.9544.
Explanation of Solution
The calculation of the expected value (Z) for the outcome being at least $14,400 is shown below.
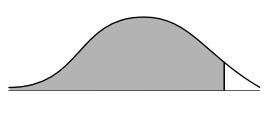
The expected value is 0.4505 when Z is (+ or -) 1.65 and 0.5000 when Z is 0. So, the probability of the outcome being at least $14,400 is 0.9505. The graph of this probability is shown below.

e.
To calculate: The probability that the outcome will be less than $19,200 or greater than $26,400.
Introduction:
Probability:
The likelihood of the occurrence of an event or of a proposition to be true, when expressed numerically or quantitatively, is termed as probability.
e.
Answer to Problem 20P
The probability that the outcome will be less than $19,200 or greater than $26,400 is 0.4672.
Explanation of Solution
The calculation of the expected value (Z) for the outcome being less than $19,200 is shown below.
The expected value is 0.3413 when Z is (+ or -) 1 and 0.5000 when Z is 0. So, the probability of the outcome being less than $19,200 is 0.1587 (0.5000 – 0.3413).
The calculation of the expected value (Z) for the outcome being greater than $26,400 is shown below.
The expected value is 0.1915 when Z is (+ or -) 1 and 0.5000 when Z is 0. So, the probability of the outcome being at least $14,400 is 0.3085 (0.5000 – 0.1915).
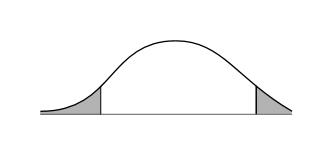
Hence, the probability that the outcome will be less than $19,200 or greater than $26,400 is 0.4672. The graph of this probability is shown below.

Want to see more full solutions like this?
Chapter 13 Solutions
FOUND.OF FINANCIAL MANAGEMENT-ACCESS
- Answer in step by step with explanation. Don't use Ai and chatgpt.arrow_forwardArticle: Current Bank Problem Statement The general problem to be surveyed is that leaders lack an understanding of how to address job demands, resulting in an increase in voluntary termination, counterproductive workplace outcomes, and a loss of customers. Bank leaders discovered from customer surveys that customers are closing accounts because their rates are not competitive with area credit unions. Job demands such as a heavy workload interfered with employee performance, leading to decreased job performance. Healthcare employees who felt the organization’s benefits were not competitive were more likely to quit without notice, resulting in retention issues for the organization. Information technology leaders who provide job resources to offset job demand have seen an increase in (a) new accounts, (b) employee productivity, (c) positive workplace culture, and (d) employee retention. The specific problem to be addressed is that IT technology leaders in the information technology…arrow_forwardHow to rewrite the problem statement, correcting the identified errors of the Business Problem Information and the current Bank Problem Statement (for the discussion: Evaluating a Problem Statement)arrow_forward
- Don't used hand raiting and don't used Ai solutionarrow_forward3 years ago, you invested $9,200. In 3 years, you expect to have $14,167. If you expect to earn the same annual return after 3 years from today as the annual return implied from the past and expected values given in the problem, then in how many years from today do you expect to have $28,798?arrow_forwardPlease Don't use Ai solutionarrow_forward
- Ends Feb 2 Discuss and explain in detail the "Purpose of Financial Analysis" as well as the two main way we use Financial Ratios to do this.arrow_forwardWhat is the key arguments of the supporters of the EITC? Explain.arrow_forwardWhat is the requirements to be eligible to receive the EITC? Explain.arrow_forward
 Essentials of Business Analytics (MindTap Course ...StatisticsISBN:9781305627734Author:Jeffrey D. Camm, James J. Cochran, Michael J. Fry, Jeffrey W. Ohlmann, David R. AndersonPublisher:Cengage Learning
